


The Urban Design Group at Foster + Partners has a long history of working across cities and scales, from complex buildings and small-scale public realms to the creation of new cities and large-scale strategic planning. In recent years, the team has adopted an increasingly data-driven approach and, in doing so, helped pioneer a change in course for the application of urban design as we know it.
24th October 2022
The Science of Urban Form: Data-driven solutions to real-world problems
Data science in architecture and urban design
In the last decade, our increasingly digital world has seen a deluge of data being produced. The transformation of this into applicable knowledge – and its frequent sale to the highest bidder – has had profound effects on many fronts; terms like big data, data science, and machine learning have become familiar and penetrated almost every industry, from healthcare and advertising to design and planning.
In the context of urban design, the all-pervasive nature of data science has brought an interdisciplinary approach to the way we design and analyse cities. The information explosion is being generated from many different sources and includes the data we produce actively, by interacting with our phones and computers, as well as data we produce passively, from embedded devices in the urban environment, such as traffic cameras, to satellites that constantly monitor our environment.
Despite its scale – from smart phone to satellite – the management of such a vast amount of information shouldn’t be considered a burden. Instead, there is an opportunity to turn swathes of statistics into a reliable resource for a better world.
Intelligent analysis has the potential to inform design decisions and create more socially and environmentally sustainable places.
Indeed, this novel approach to architecture and urban design has already begun to have a profound impact on our cities and communities; how new urban spaces are designed; how they look; and how our understanding of existing places has evolved.
It is vital, therefore, that architects and city planners continue to evolve their application of this data to identify and scrutinise trends and patterns across our cities. Intelligent analysis has the potential to inform design decisions and create more socially and environmentally sustainable places that respond intuitively to public need.
Data gives us answers, but what was the question?
Given the pressing concerns of the climate emergency, and the critical role cities must play, the challenge we face together, whether data scientist or designer, is how to turn information into insight, and how these insights allow us to create healthier, happier and more sustainable cities.
At the heart of Foster + Partners’ and the Urban Design Group's (UDG) work exists the aim to deliver designs and planning that makes cities work for people and planet. However, this is not simply a case of analysing street layouts and footfall scenarios in a masterplan but requires a deeper understanding how streets and spaces connect, and how they are intrinsically linked to the generation of carbon footprint.
Furthermore, the Covid-19 pandemic has taught us to almost entirely re-think the spaces we live in. Physical proximity took on a new meaning as we have reconsidered the value of our public spaces, our homes and the way we work. It also taught us that localism has always been present but sometimes undermined in the promotion of big data and smart cities.
The Urban Design Group has worked with tools and developed methodologies to integrate data science into all levels of urban design practice.
Pre-pandemic, the combination of smart technology and urbanism was still thought to be mainly focused on large-scale city infrastructures, like intelligent transport and smart energy grids. However, as we will demonstrate, we are seeing a shift in focus to the social needs of citizens and communities. This is the true purpose of cities: to enable a huge number of individuals to live not just in a safe but an adaptable, sustainable and resilient urban environment.
With that mind, the UDG has worked with tools and developed methodologies to integrate data science into all levels of urban design practice. Tools that not only help us inform and deliver projects at a wide range of scales but, most importantly, that help us answer questions tailored to specific design problems.
Indeed, knowing what question to ask is a fundamental part of the data science process – arguably the most important part. Urban designers and data scientists alike have been trained to understand the ‘context’ of data in order to ascertain its optimum application towards a design question, and create maximum value.
Data that can give us insights into the functioning of urban environments are plentiful: from social media data that can help capture public perceptions about a place, to call detail record (CDR) data gathered by telecom companies that capture how people move around and use urban areas. However, these data sets all have a particular context – caveats of how the data was collected – that must be understood before any insights can be extracted. This context might be as broad as: what part of the population is being captured? Or as narrow as: what personal biases might be implicit in the data? These contexts create specific constraints on how the data can be used and how insights can be extrapolated for decision making.
Our methodology in integrating urban design and data science can be categorised into three approaches: Understanding cities and regions, master planning new cities, and predicting people’s movement behaviour. In this essay, we will frame each approach with a question, and explain the different tools – and data sets – at our disposal.
Understanding Cities and Regions: How do we shape our cities and how do they shape us?
Over the years, the UDG has learned to forensically study what makes cities tick to gain a detailed understanding of their DNA. We question how certain patterns, relationships and geographic contexts come together to shape cities and regions. And we look at how such elements affect the way we live and move.
However, like DNA, cities are extremely complex. They are morphological systems composed of different forms, objects and processes. To deal with this complexity, it is necessary to identify relationships between the objects, from the part to the whole, and recognise hierarchies within them.
In urban morphology, this hierarchical view is structured according to a set of fundamental physical elements. These large-scale elements of urban form are some of the pieces that we scrutinise with data science techniques.
Firstly, at a general level, a city is defined by its natural context – its topographical conditions, such as bodies of water, rivers, mountains and other landscape elements.
At a finer level, a city is composed of its street system – the largest public space of the city, the place where we meet and interact. Consequently, streets also define the blocks or plots that constitute the urban realm, defining what is public and what is private.
Lastly, at a more granular level still, is the architectural system – building elements that are defined by their form (such as courtyard block or tower) or by their use (industrial, residential, commercial, etcetera).
There are several ways in which we use data science and urban computational tools to analyse these elements – information that tells us where and why things happen in cities. One of the most common is the use of digital cartographic tools, known as Geographical Information Systems (GIS).
Often regarded as a mapping tool, a GIS can also be considered a tool for data science as it allows us to create, manage, analyse and visualise spatial data. Formally established by the US-based Environmental Systems Research Institute (ESRI) in the 1960s, a GIS is designed to capture, manipulate, store and manage data. They are, in simple terms, an extension of cartography – the science of making maps – and allow a person to visualise and interpret data. A GIS platform normally contains a base map where additional data has been added as necessary. There is no limit to the amount of data that can be added to a GIS map, which capitalises on analysis and visualisation of data in support of research or qualitative analysis.
By representing and analysing data using GIS techniques, the UDG works with spatial models that evaluate how the structure of the built environment performs at a geographic scale, via the hierarchies of topography, streets and architecture outlined above. Outcomes from this analysis include the optimised physical form for a city, its most efficient land-use patterns or mobility options and predictions of demographic characteristics.
Slide 1 of 1
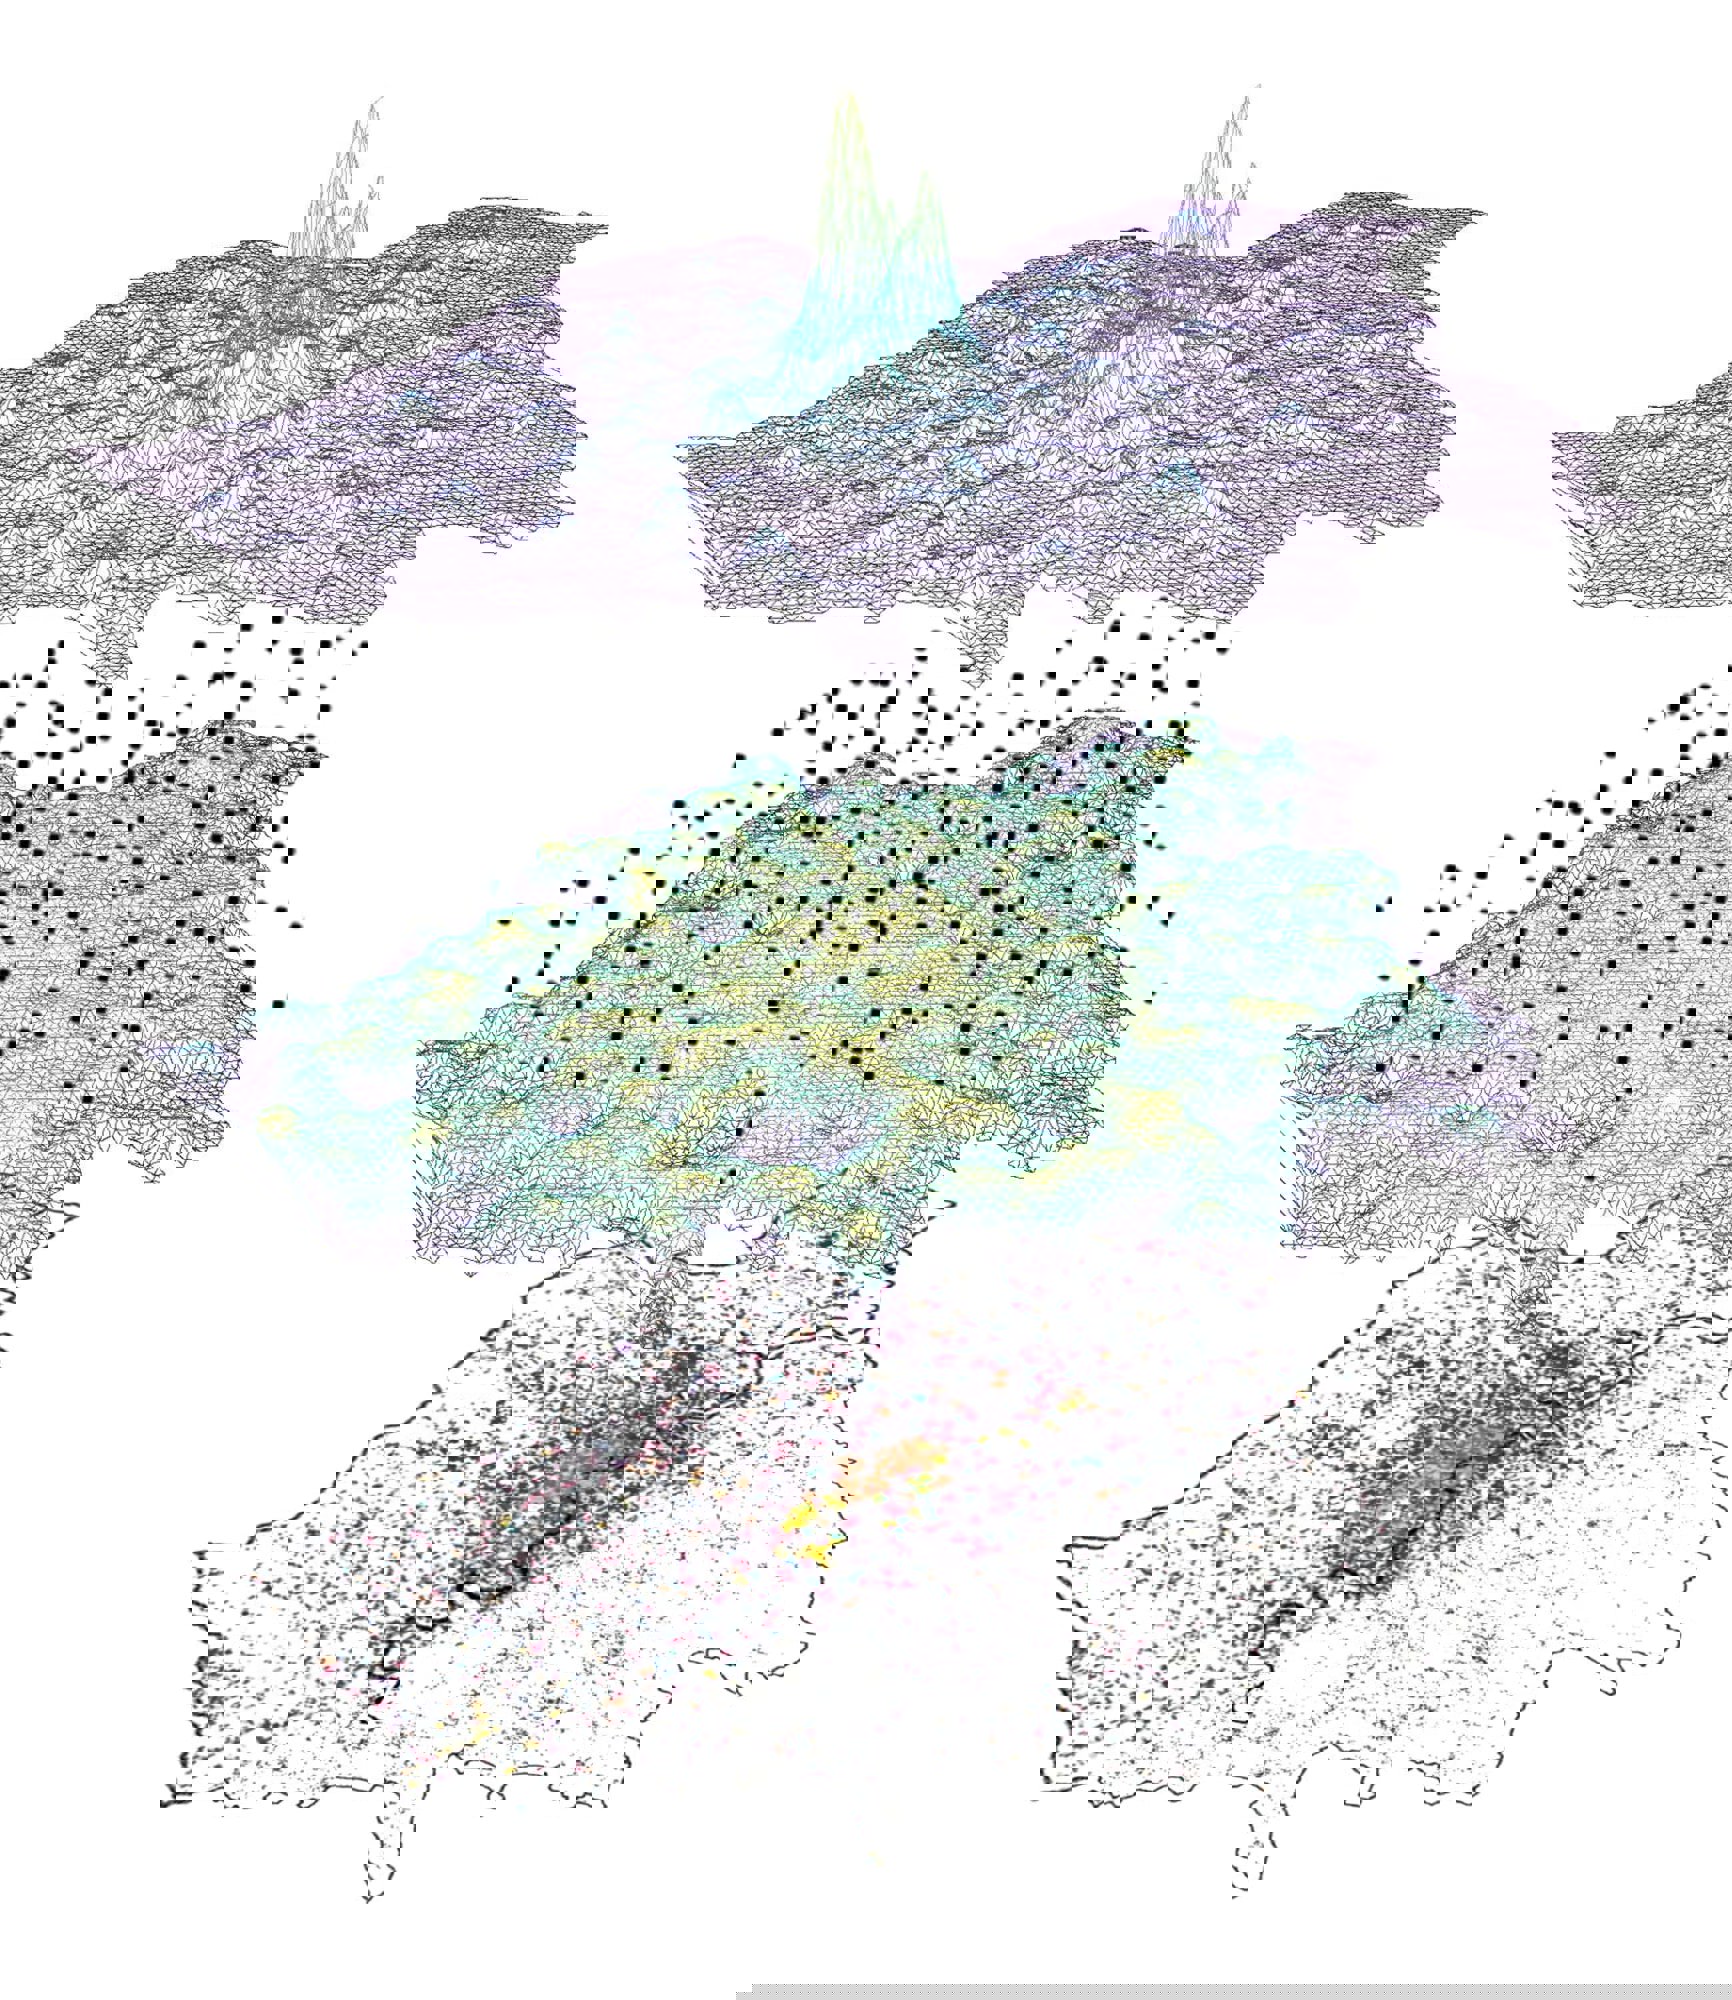
Identification of local activity centres using point-of-interest data for Greater London; the UDG calculated the local entropy of each point of interest and found the local maxima to classify local activity areas. For each local activity area, the team computed the density of amenities to determine their attractiveness. © Foster + Partners
Slide 1 of 1
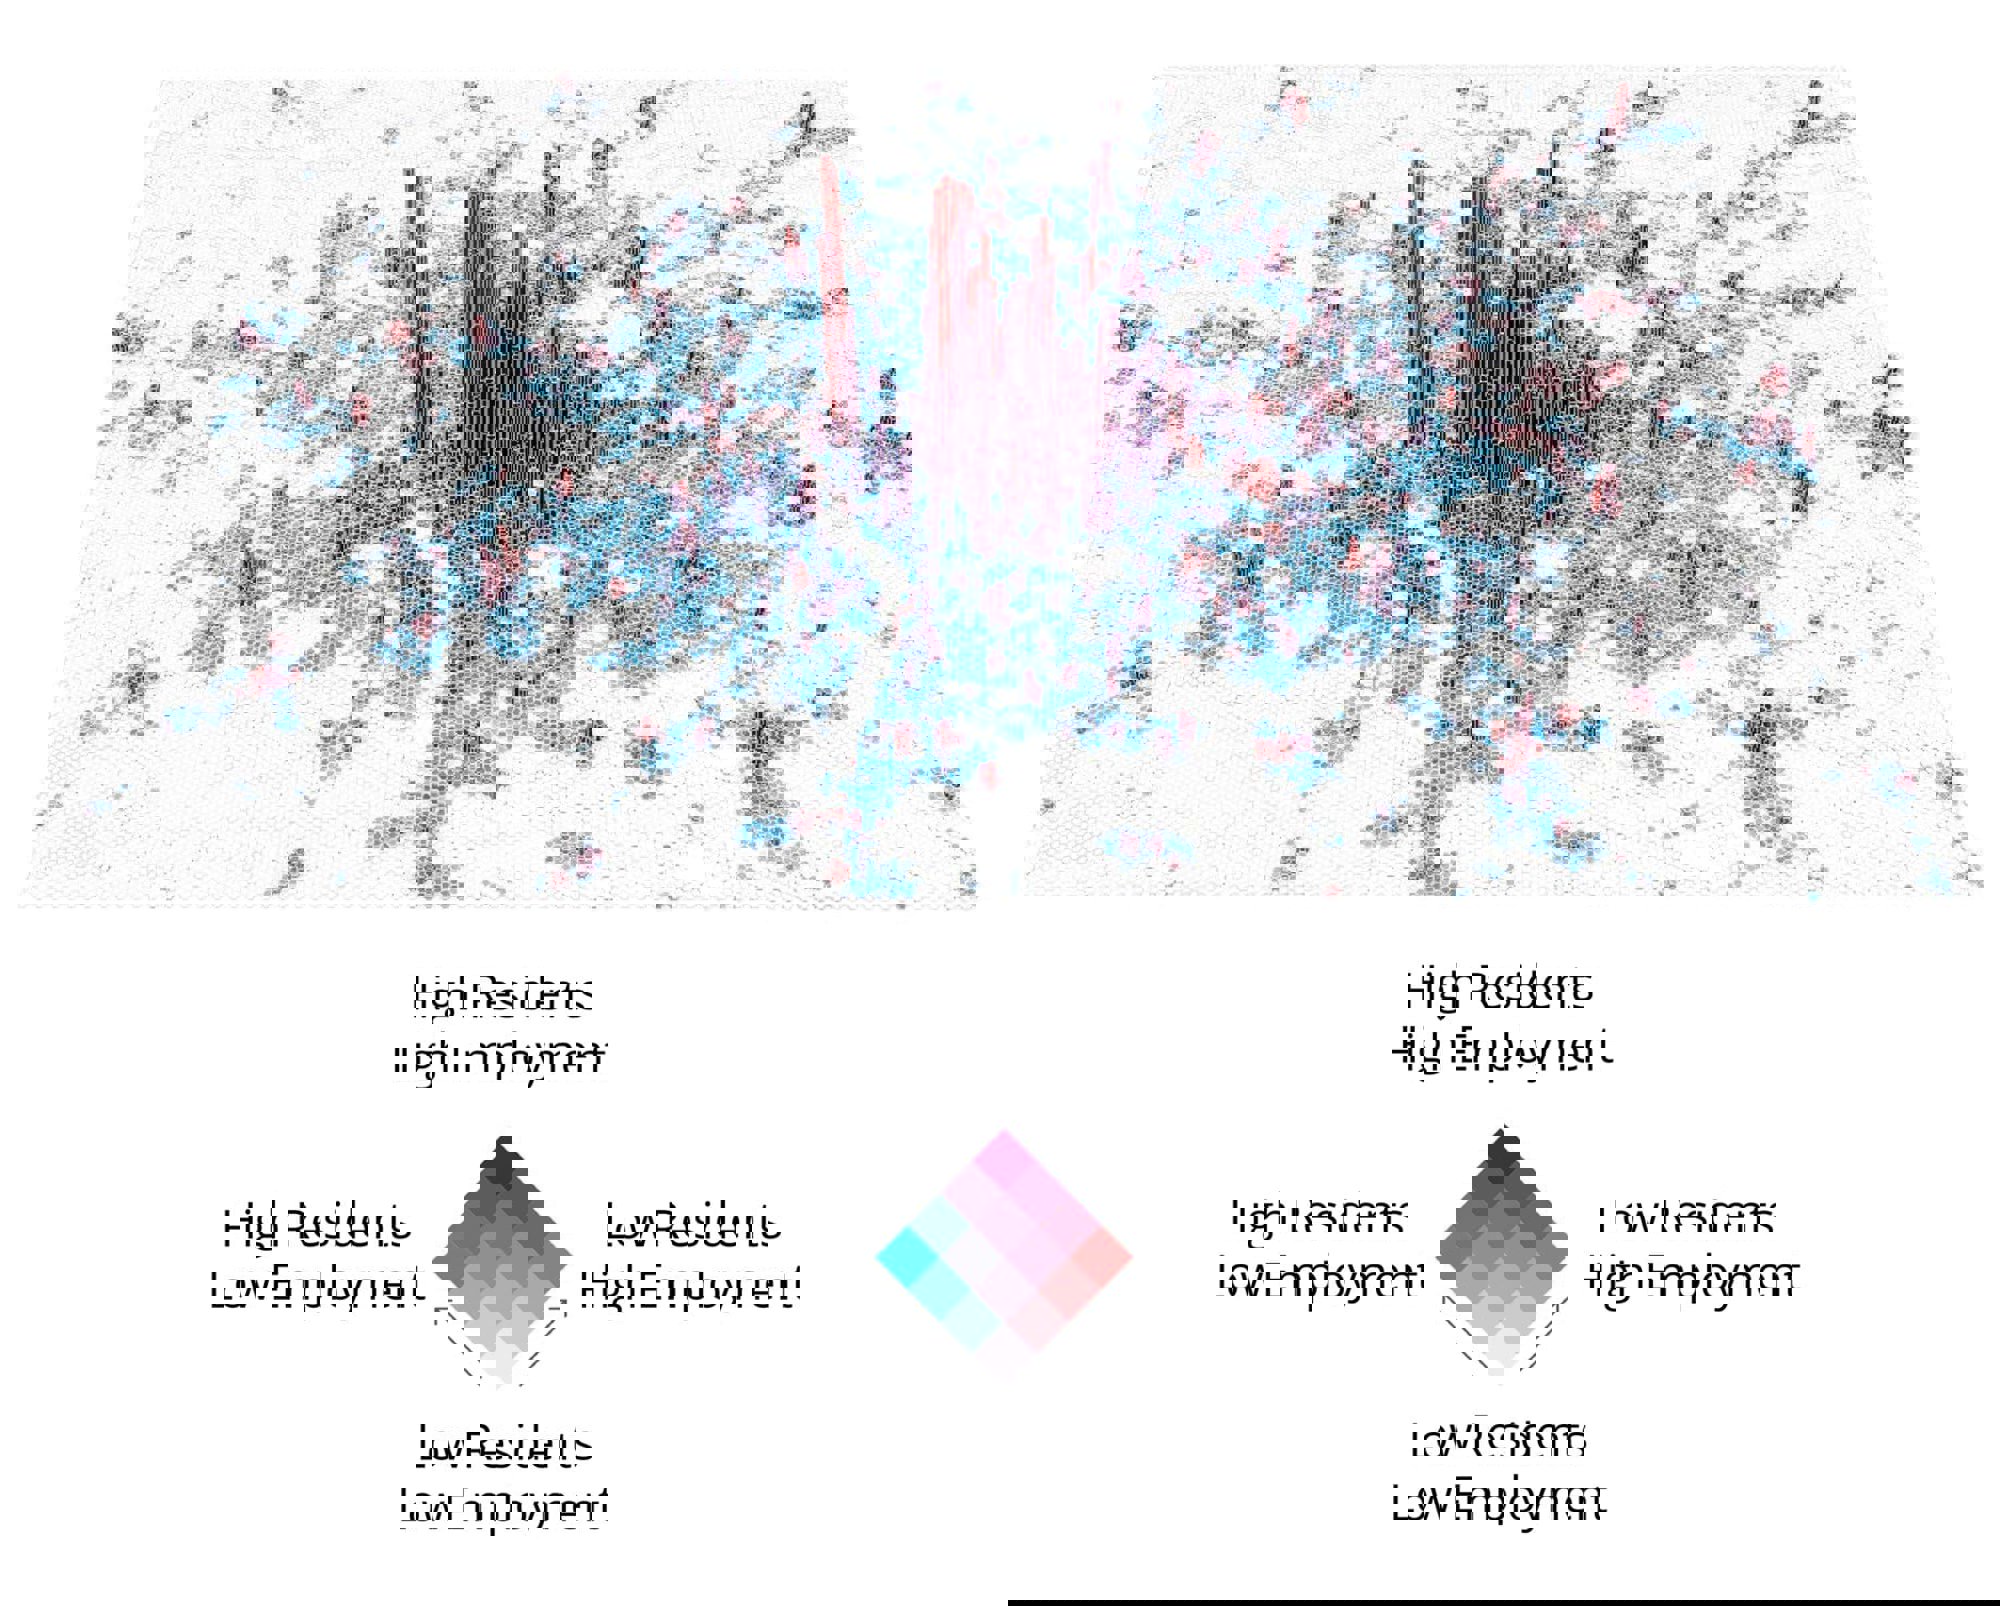
Map of population density in Greater London; using population census data for Greater London, the UDG analysed and visualised in three dimensions where people live and work. Clusters of low and high domestic populations (residents) and working populations (employment), are illustrated alongside a mix of both. © Foster + Partners
Data-driven GIS analysis can help generate better pedestrian flows and social interactions that sustain economic development, improve public health, lower transportation energy expenditure, and build social awareness – all of which form a comprehensive framework of urban sustainability at a large scale.
In a more specialised field of data science at this scale, the UDG approaches cities and regions as a network of connections in a scientifically measurable ‘object’. The accurate analysis of this urban object can predict how people are going to use the city; it can measure spatial relationships, such as how we move, interact and trade.
At this level, urban design is concerned with questions like: How can street and block design reconnect urban neighbourhoods? How does a new piece of the city impact the way people travel? What has caused a specific distribution of land uses? Or what does the spatial structure of a city tell us about its function? All these kinds of questions require that we think of space as a pattern of relationships whose structure we need to understand.
The UDG works with spatial models that evaluate how the structure of the built environment performs at a geographic scale
The UDG has tackled such questions by employing spatial science-based analytical techniques – one of which is Space Syntax. Based on extensive research in the 1980s by urbanists Bill Hillier and Julienne Hanson, Space Syntax works on the theory that we choose paths not only to reduce physical exertion but also to develop and maintain efficient mental descriptions of environments; functionality and legibility of a space are closely interlinked.
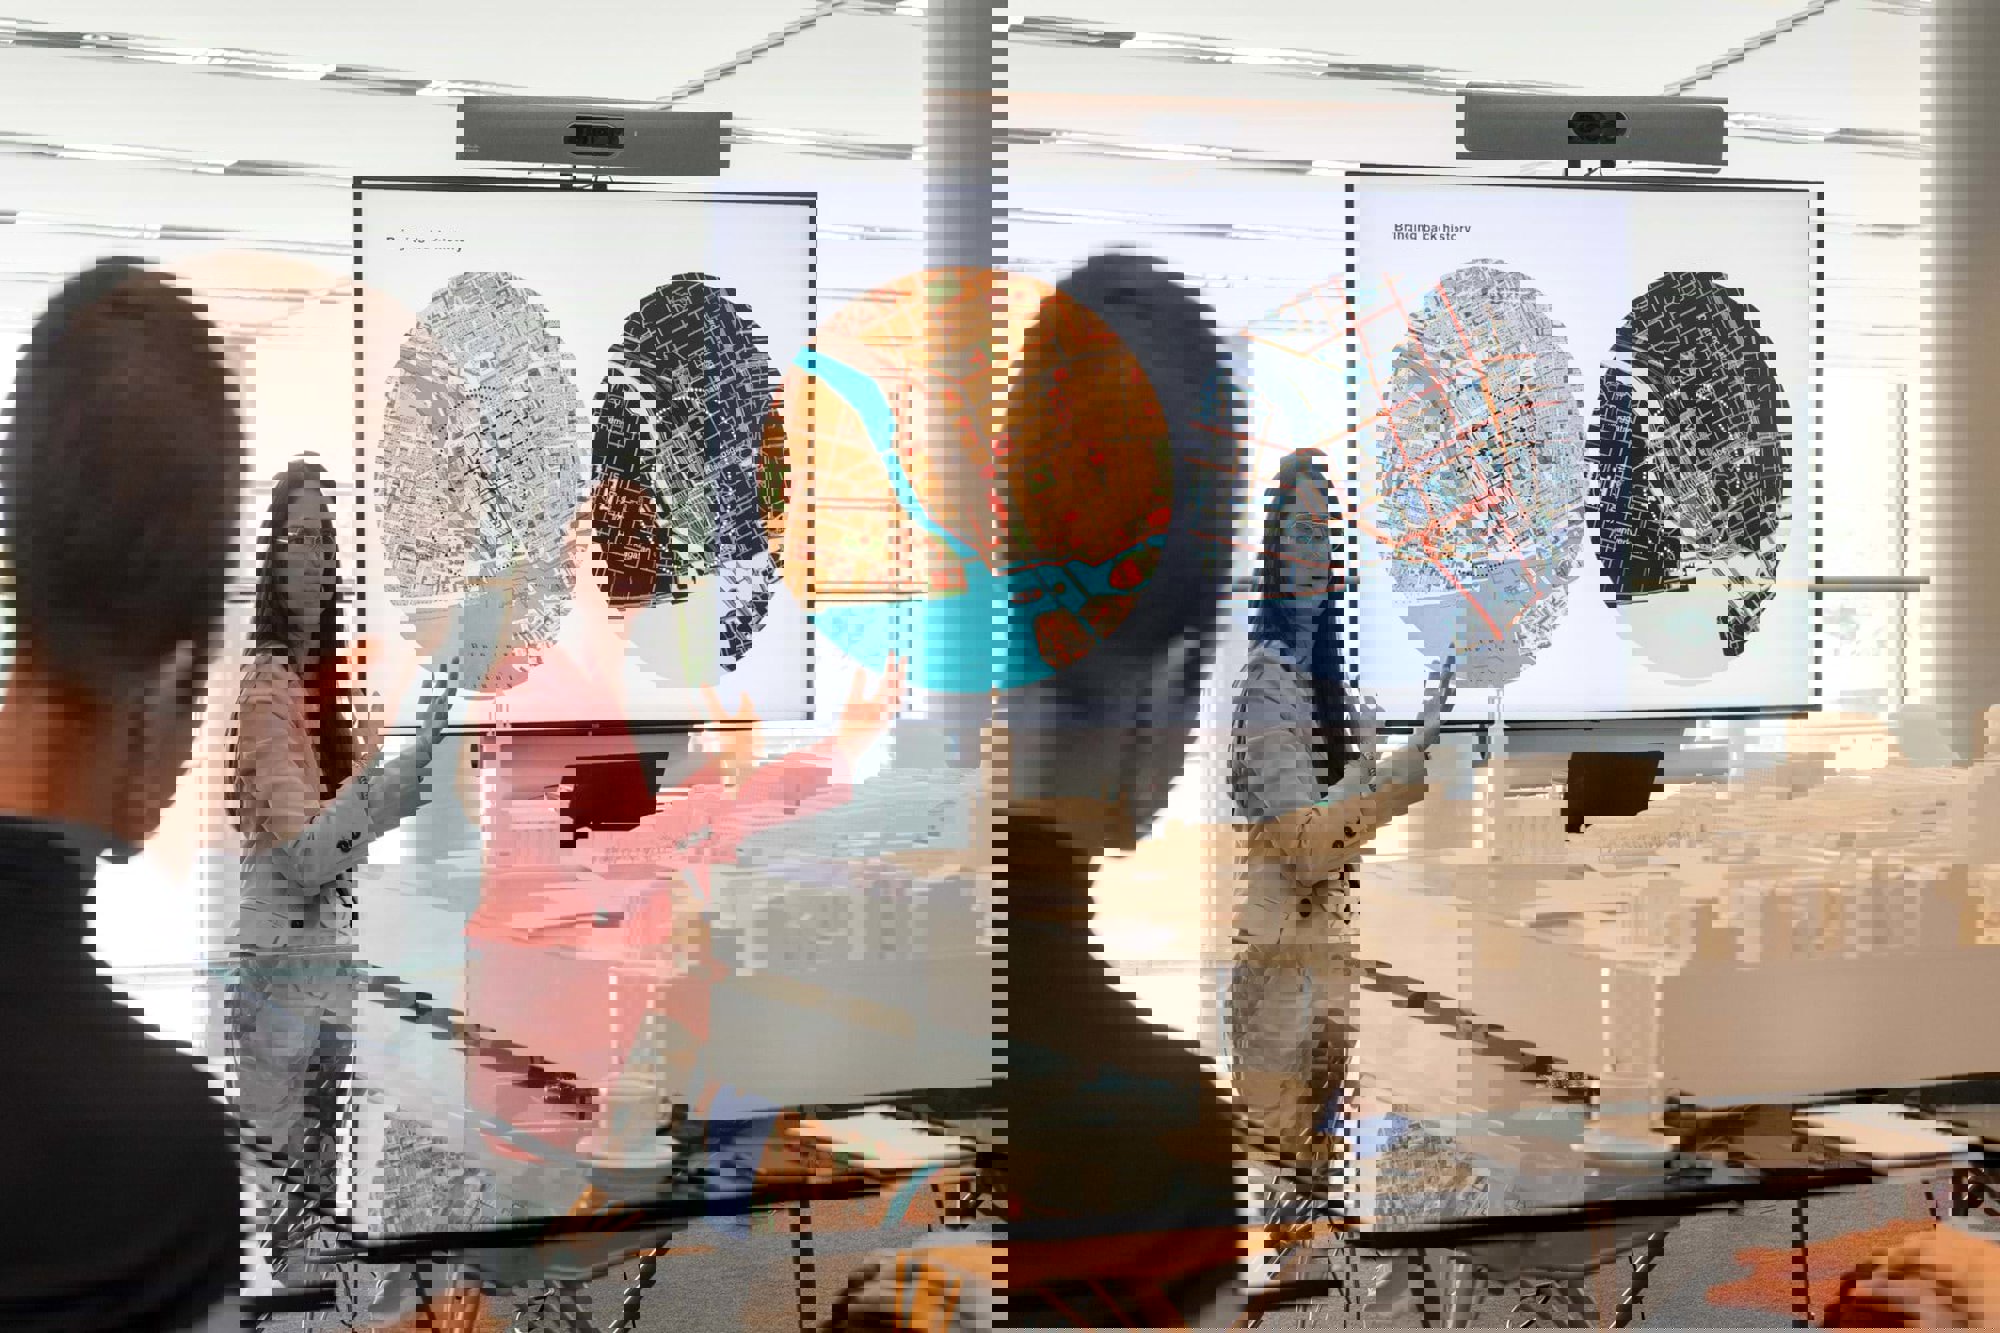
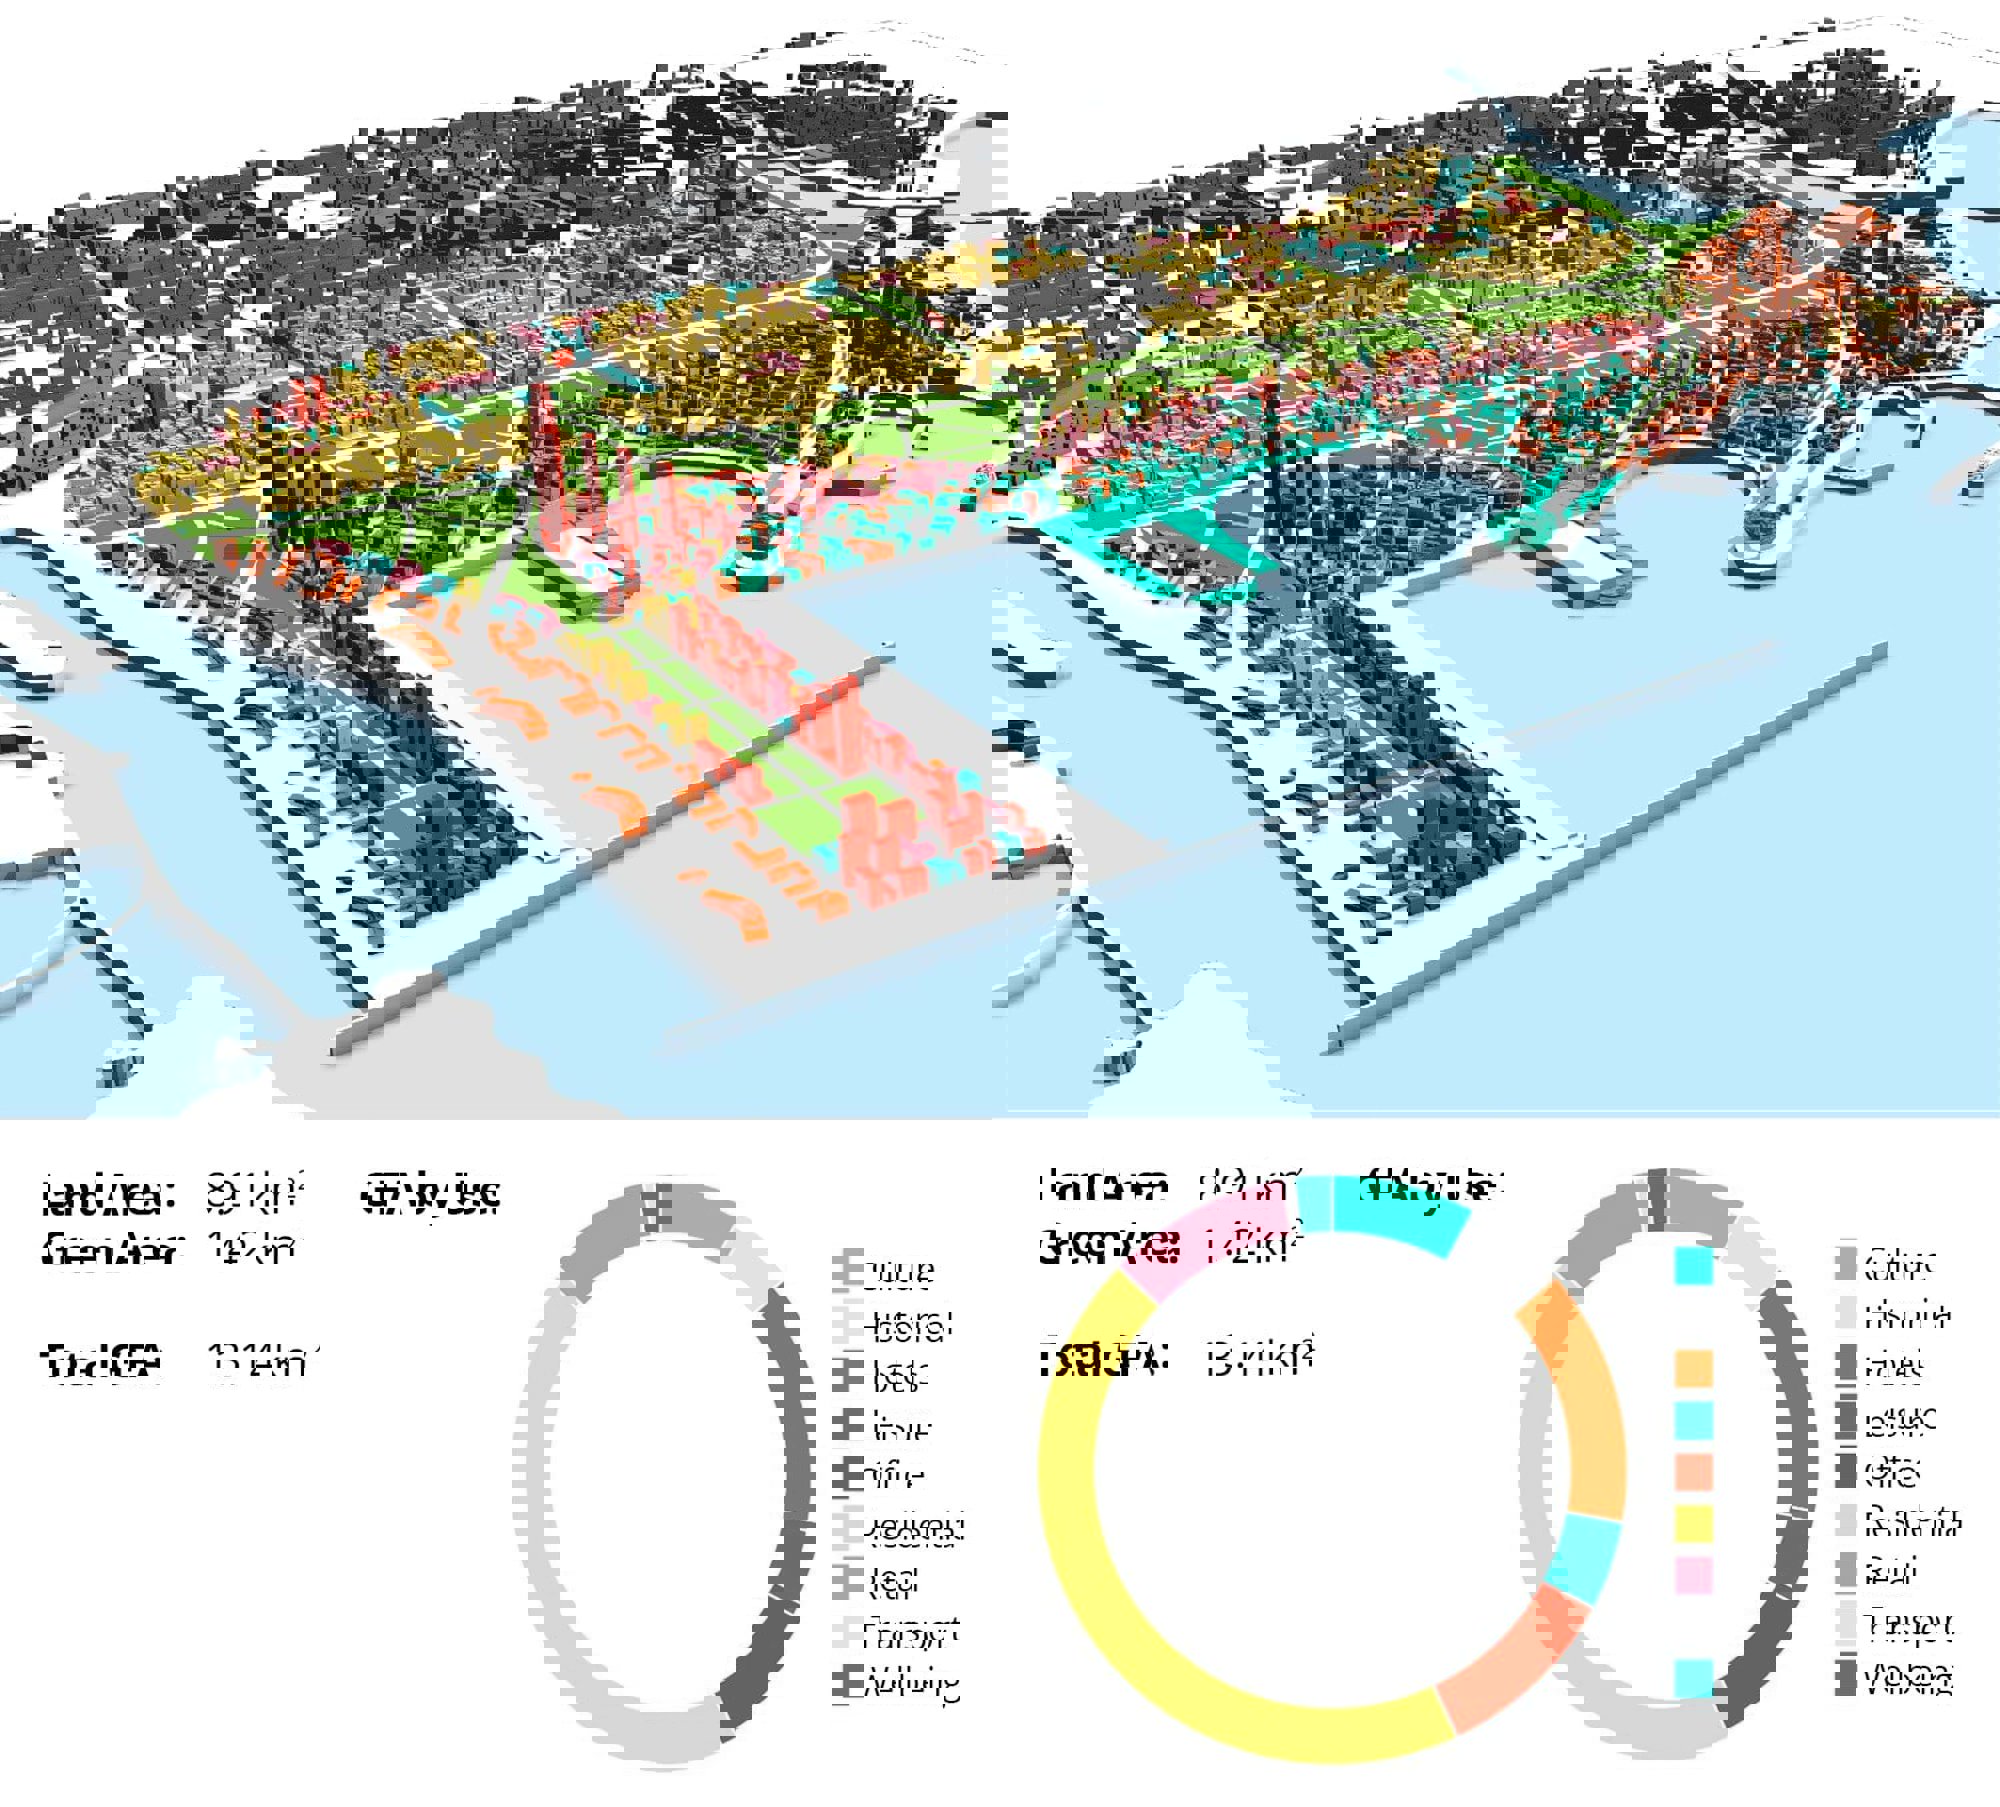
In a recent example, the UDG's analysis formed a vital part of the practice’s work on the competition-winning design for the development of Stockholm Central Station. The development brings several modes of transport together in a single, integrated hub, creating a new mixed-use district for the city of Stockholm. This approach helped inform design decisions from the outset, with the aspiration to create the world’s first carbon restorative transport interchange. We used Space Syntax analysis to model the future ‘connectedness’ of the redeveloped historic street network and the potential socio-economic impact of the designs on the station and the city. The outcome was a notable 70 per cent increase in pedestrian flows and a 50 per cent increase in public open space.
Slide 1 of 1
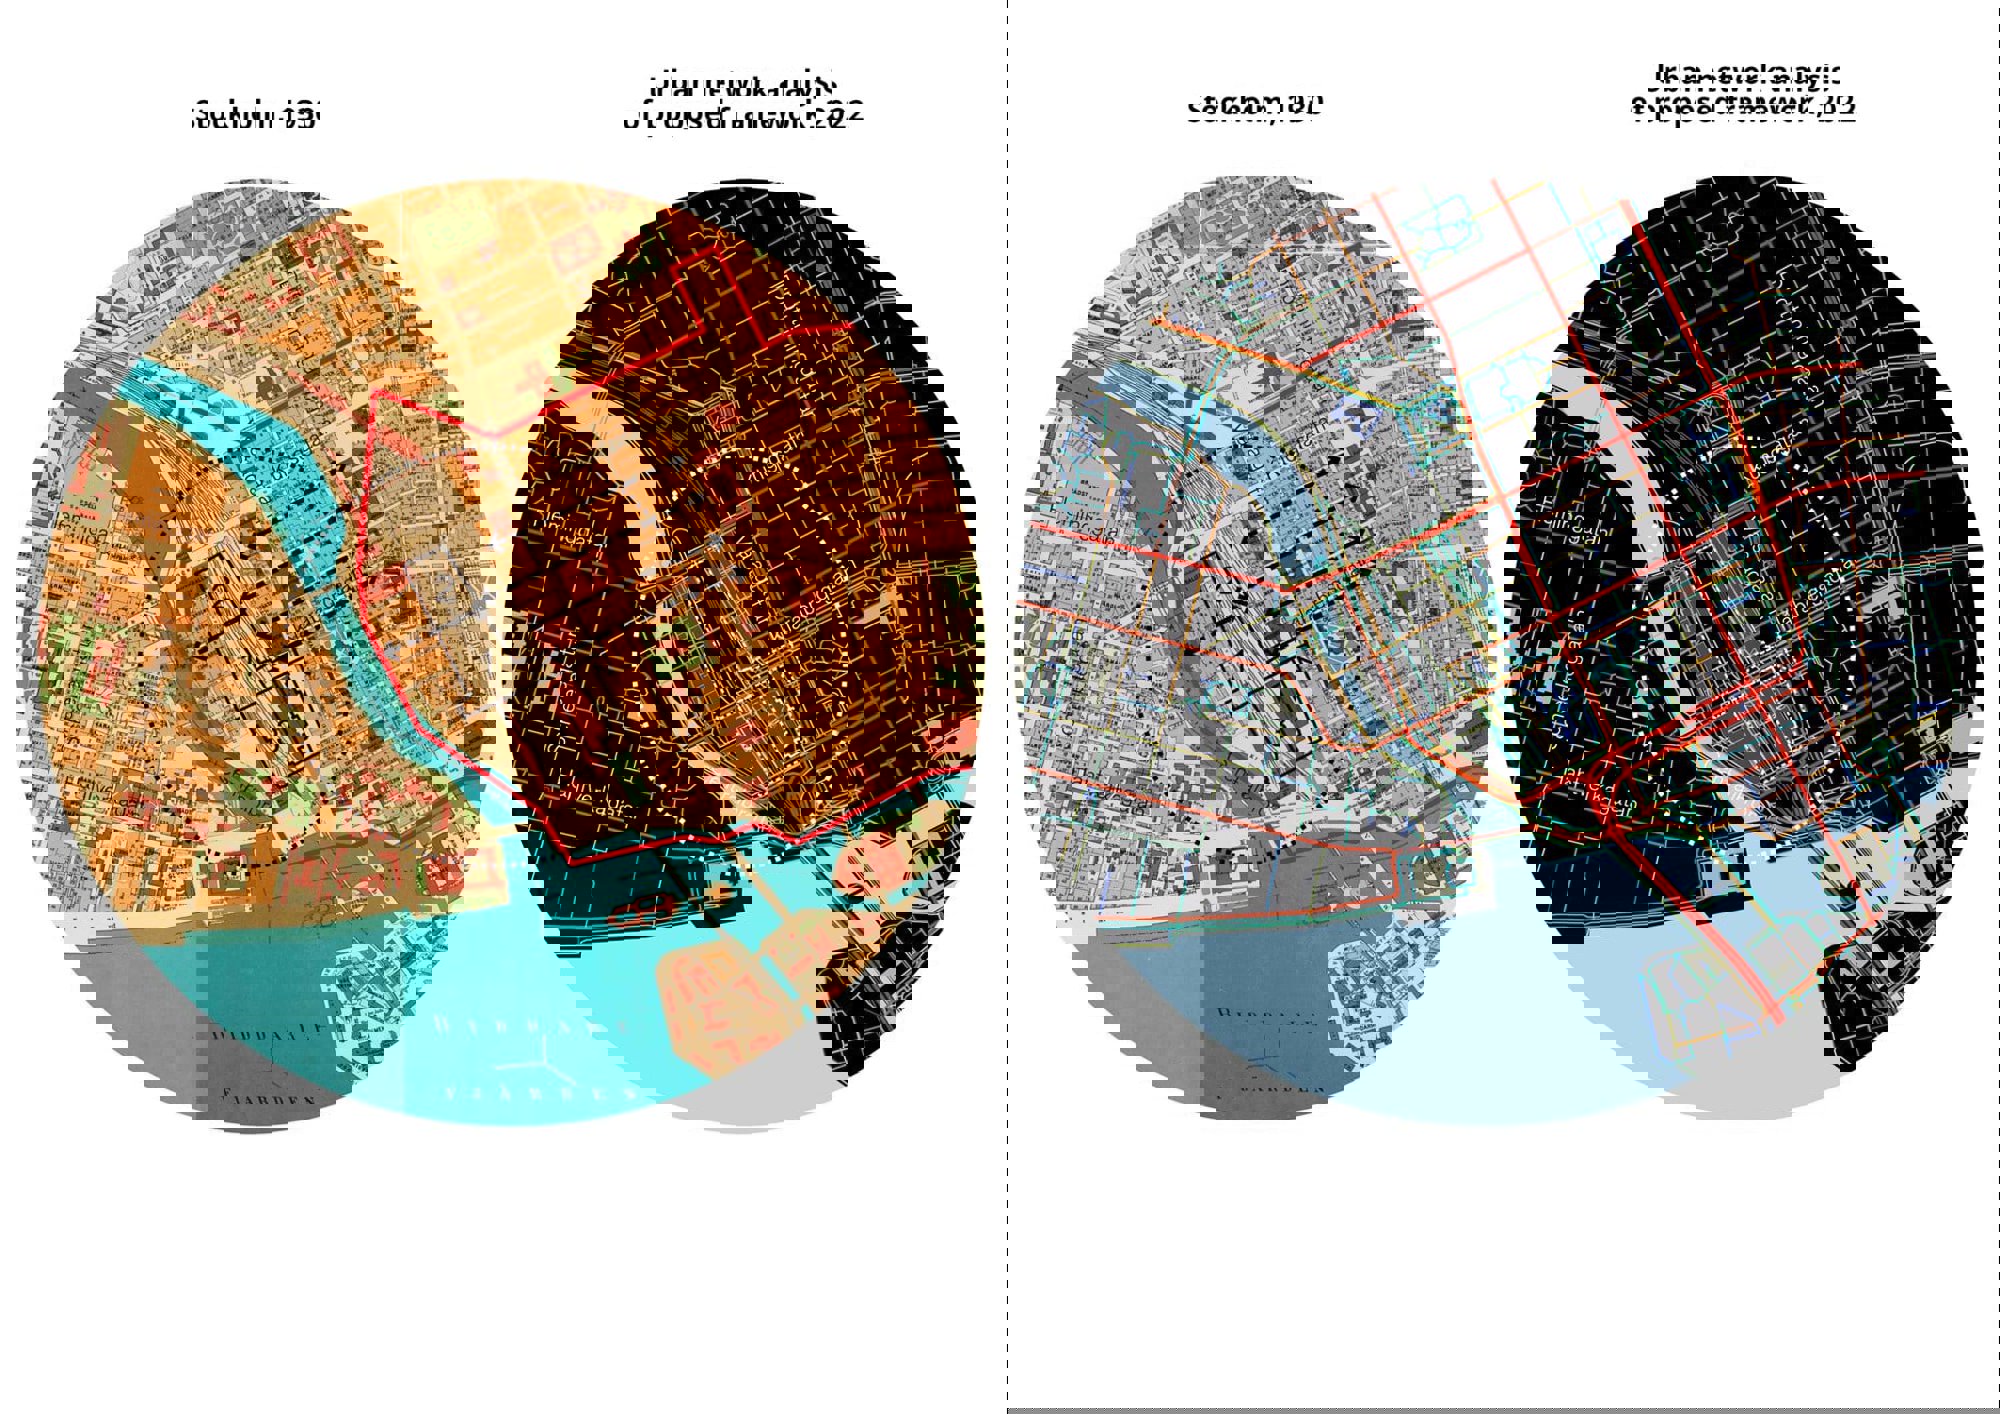
Historic maps of the city act as a main design driver for the proposal for the Stockholm Central Station competition; the UDG investigated compared early city grids of the Central Station area with analysis of the existing street connectivity to better understand current connectivity and identify opportunities for improvement. © Foster + Partners
Slide 1 of 1
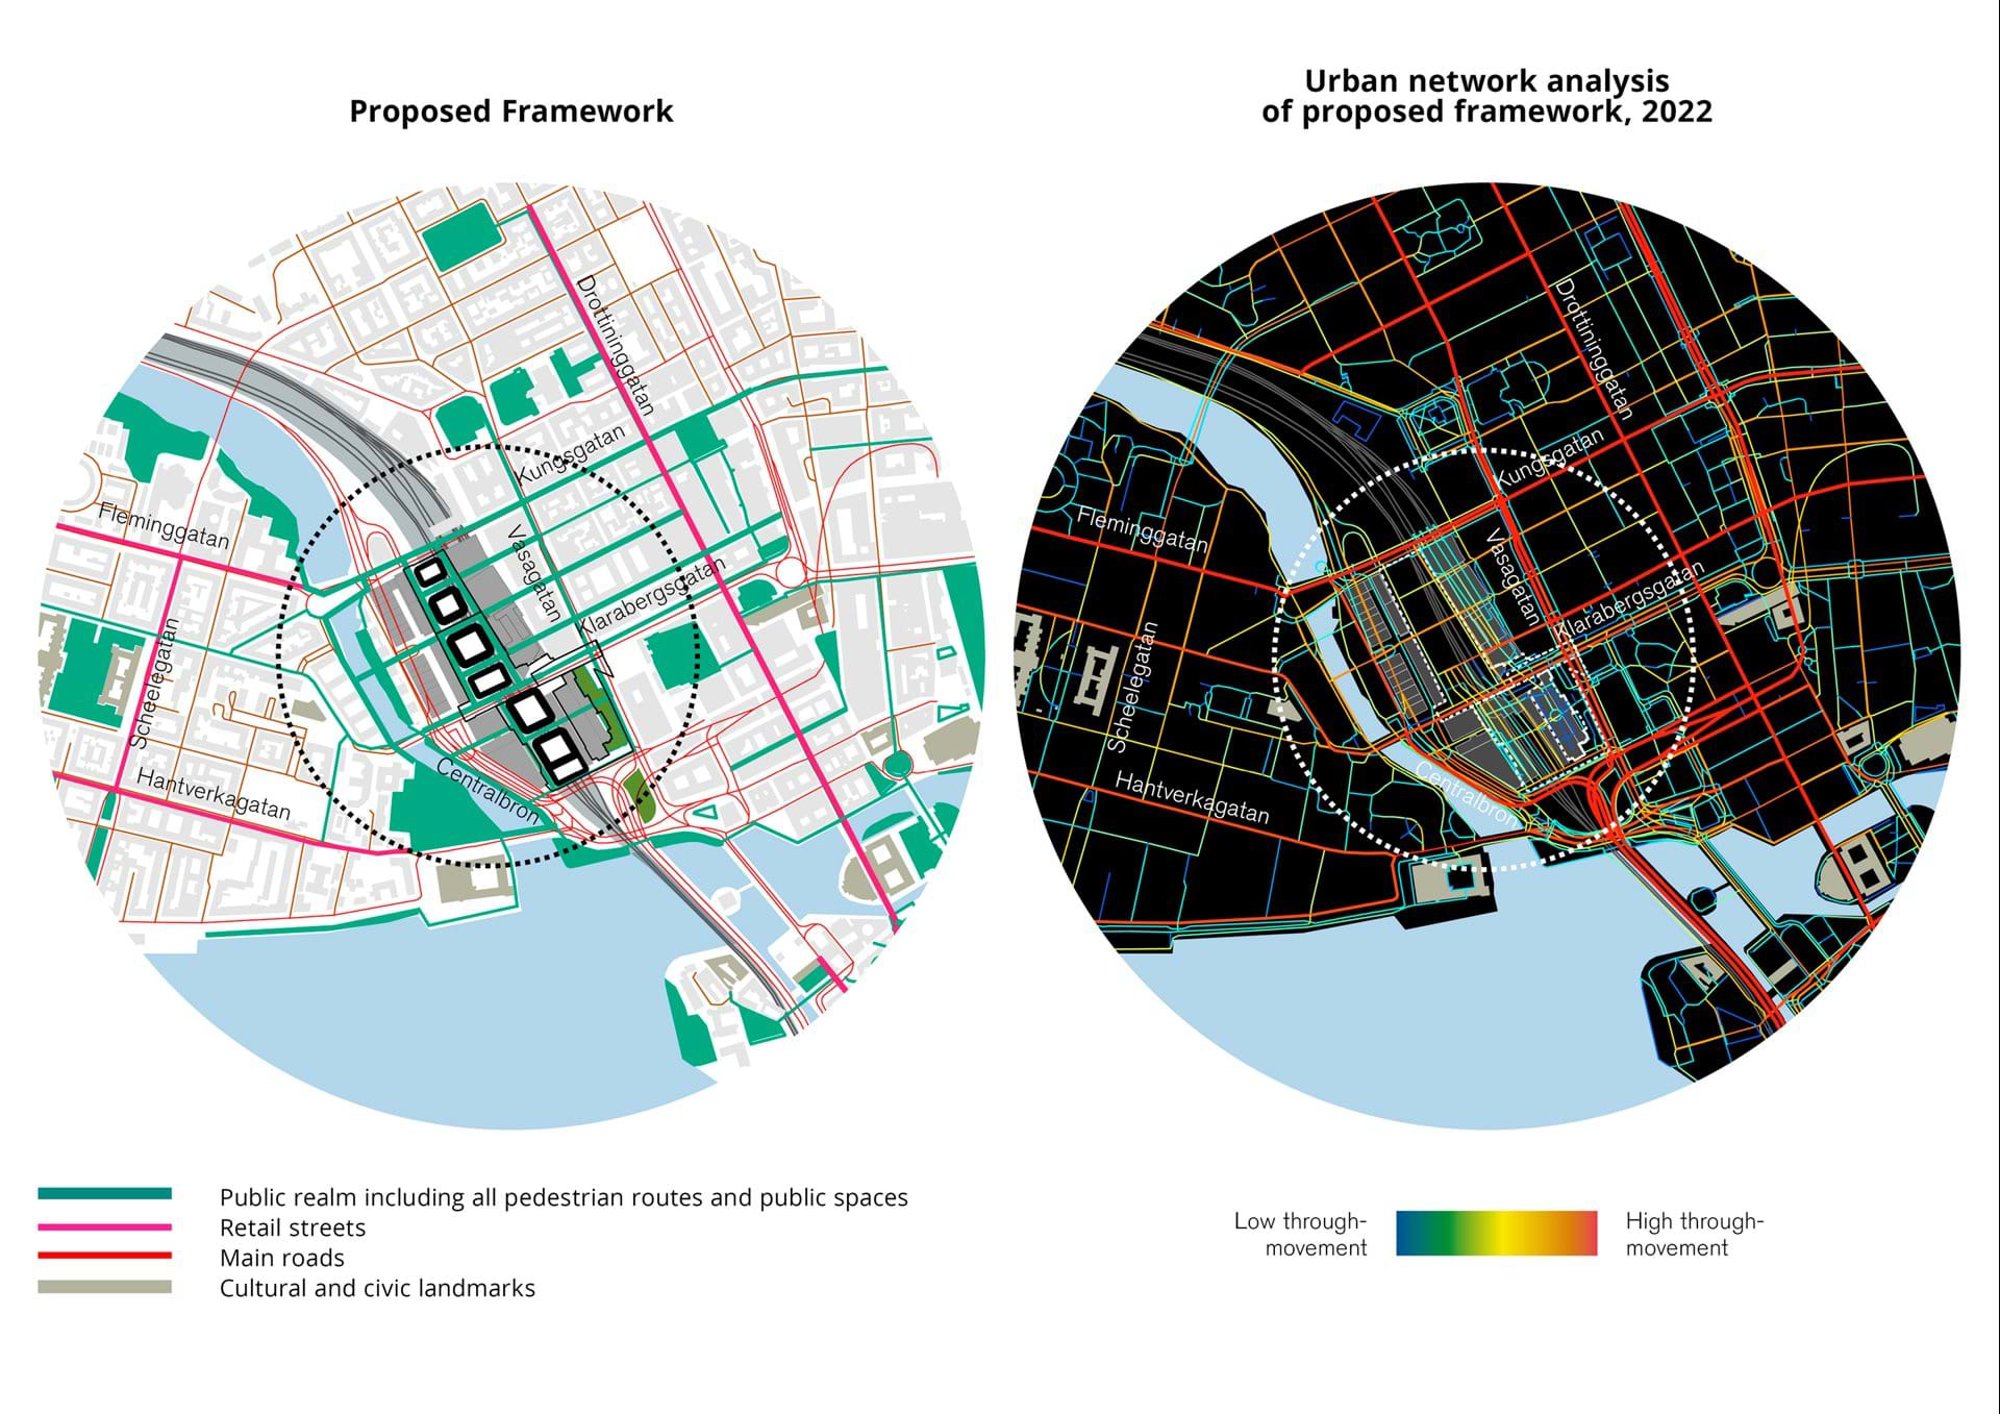
Proposal to re-establish historical street connections at Stockholm Central Station, re-stitching the station into the city’s urban fabric; the team tested new proposals to future-proof the design. Results showed a 70-per-cent increase in accessible streets (a higher street connectivity) to allow greater movement – pedestrian or otherwise – to and from the station. © Foster + Partners
However, the tools and methods we employ are not only applied to new projects, but also to improve our understanding of existing cities and regions. We do this by taking advantage of open data sets and combining them in novel ways to secure insights into different urban environments that would not otherwise be available.
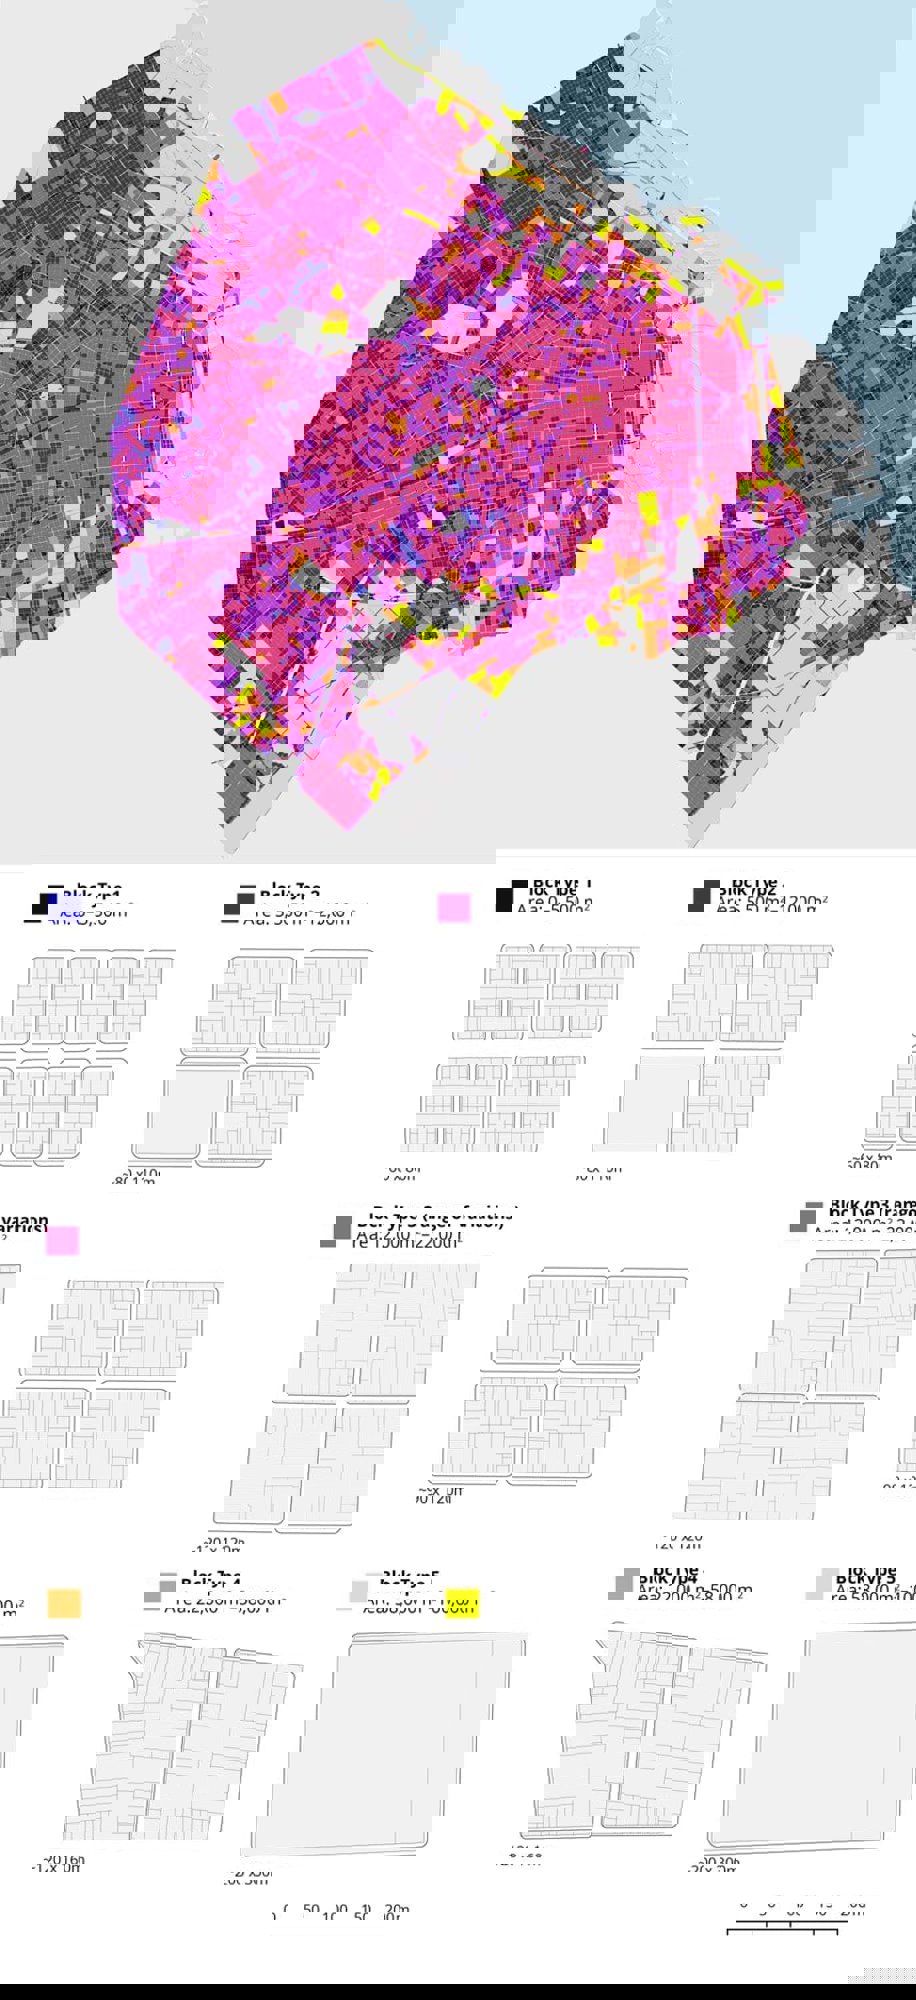
We presented an example of this type of research to the International Seminar on Urban Form (ISUF). We combined data on street networks and building footprints across five different cities to create a database of street cross-sections and a set of measures for assessing their visual complexity. This allowed us to reveal a taxonomy of street typologies that we can use as a vital new reference when working on urban environments.
Slide 1 of 1
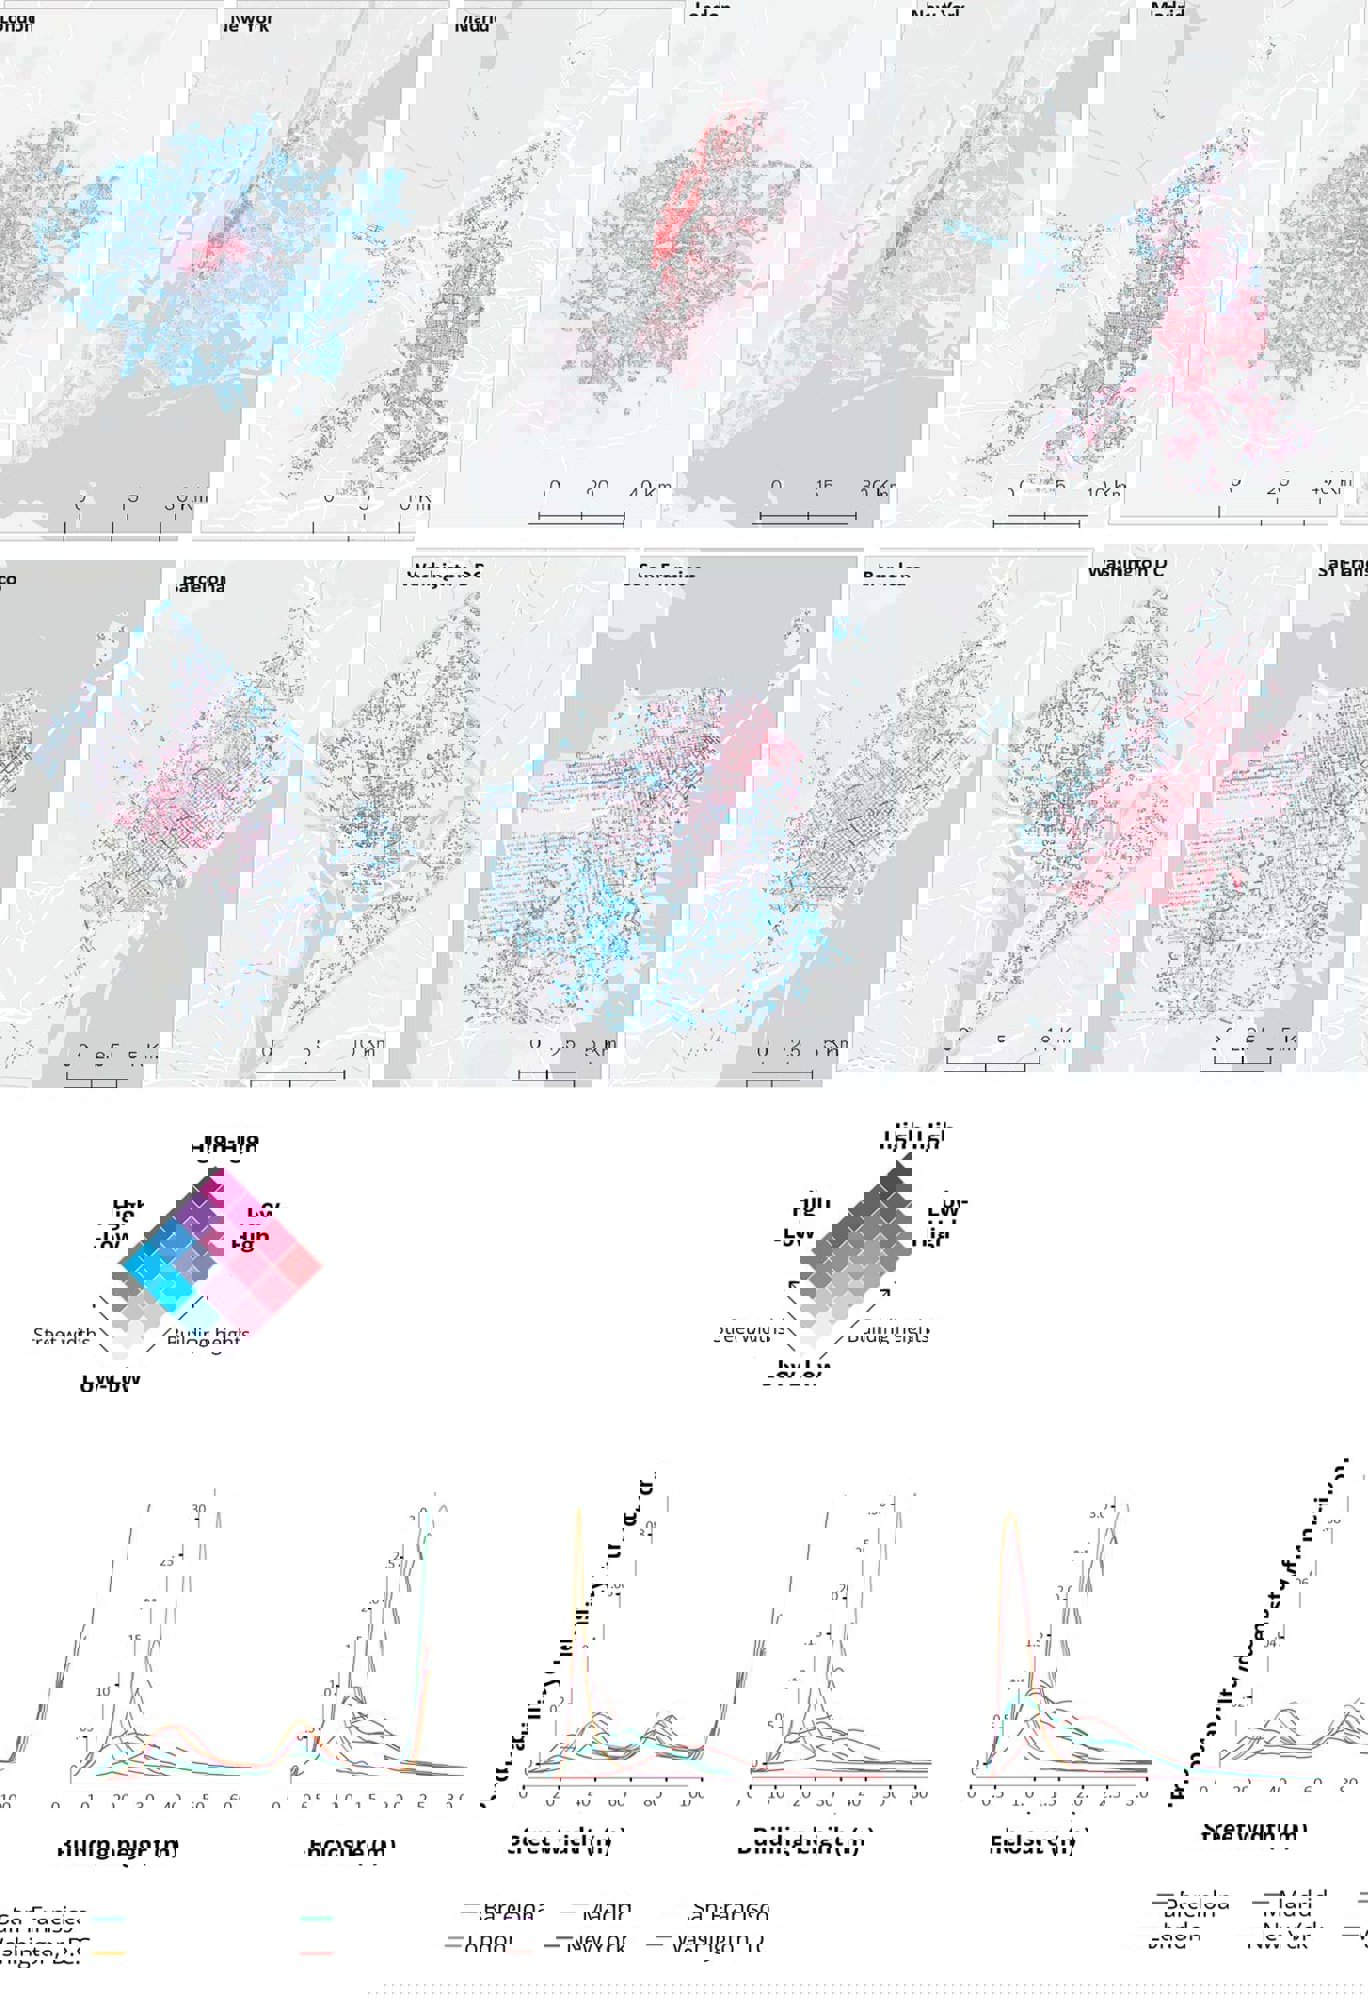
Maps produced by the UDG illustrate the spatial distribution of street widths and building heights for six different cities; the maps’ analysis highlights distinctive urban environments, and the data was plotted to compare cities by looking at the relative frequency of these measures (see graphs). These examples show us that Madrid and Barcelona are more similar in their streetscape than London is to New York. © Foster + Partners
Masterplanning New Cities: How can better urban forms create healthier, happier and more sustainable cities?
All the insights and knowledge gained from these investigations into existing environments feeds into the design process of masterplanning new cities. We use software that allows for, and helps manage, associative relationships (or how different urban elements relate to one another). For example, how a street network defines city blocks and how these, together with the land-use distribution, define both how the block is split into parcels and the types of buildings they can host.
With a greater understanding of these relationships, we can define processes that provide guidance during design rather than dictate a final output. We create rules that specify how different urban elements relate to each other or, put more simply, what types of buildings or public spaces should be built where. These rules are based on geographical context, land-use types and planning codes, and allow for a rapid and iterative design process. The generative designs we get back from our models are not final designs but rather intermediate steps that lets us evaluate different scenarios.
To achieve this, we use a host of tools that give designers the power to quickly develop, test and optimise different options. The procedures we use can be outlined as: contextual mapping, followed by generative output, design evaluation, selection and re-generation of revised options.
Contextual mapping refers to the gathering of all available information about the project area, such as the topographical landscape, transport infrastructure and morphological characteristics. This is all gathered within a GIS system and allows the designers to make high-level design decisions, such as how a street grid of a new urban area should be organised.
The data and outputs from this mapping are then used as inputs for the generative design process. For this, we use CityEngine, a modelling tool that allows design procedures to be specified as code, which can then generate three-dimensional geometry that captures the designers' intent and complies with the project requirements. This allows architects and designers to quickly iterate through different design options, evaluate them with respect to different criteria, refine the design and re-generate new options.
Using these methods and tools across different projects has allowed us to build a library of building and block typologies for different land-use types and climate regions; an invaluable resource that we can continuously reuse and refine. This has significantly cut down the amount of time spent in three-dimensional modelling, allowing us to explore more design options and evaluate their effectiveness.
Predicting Human Behaviour: How can we understand and forecast the way people move through space?
The third type of spatial data analysis employed by our team is concerned with people – the foundation of the social and economic transactions that drive any spatial environment, whether it is on an urban or architectural scale.
The prediction of pedestrian movements and crowd flows can determine the effects created by changes in urban or architectural environments. For the UDG, this is a critical part of our planning and design process.
One of the most sophisticated pieces of software we use for simulating and analysing crowds in our urban projects is Oasys MassMotion. This pedestrian simulation tool is based on fifteen years’ worth of data from academic studies on human movement and field observations.
The roots of understanding pedestrian dynamics go back to the studies of evacuation and safety in building regulations, as well as theories of fluid dynamics. A key milestone in modelling and understanding peoples’ movement was the idea of Level of Service (LoS), first coined by American engineer and urban planner John Fruin in the 1960s. The LoS concept can be thought of as a measure of how large a crowd can access a given space before movement is restricted. By using this concept as a basis, we can start to make predictions at the fine-grain level of the individual pedestrian, and predict how they might move in a crowd.
Slide 1 of 1
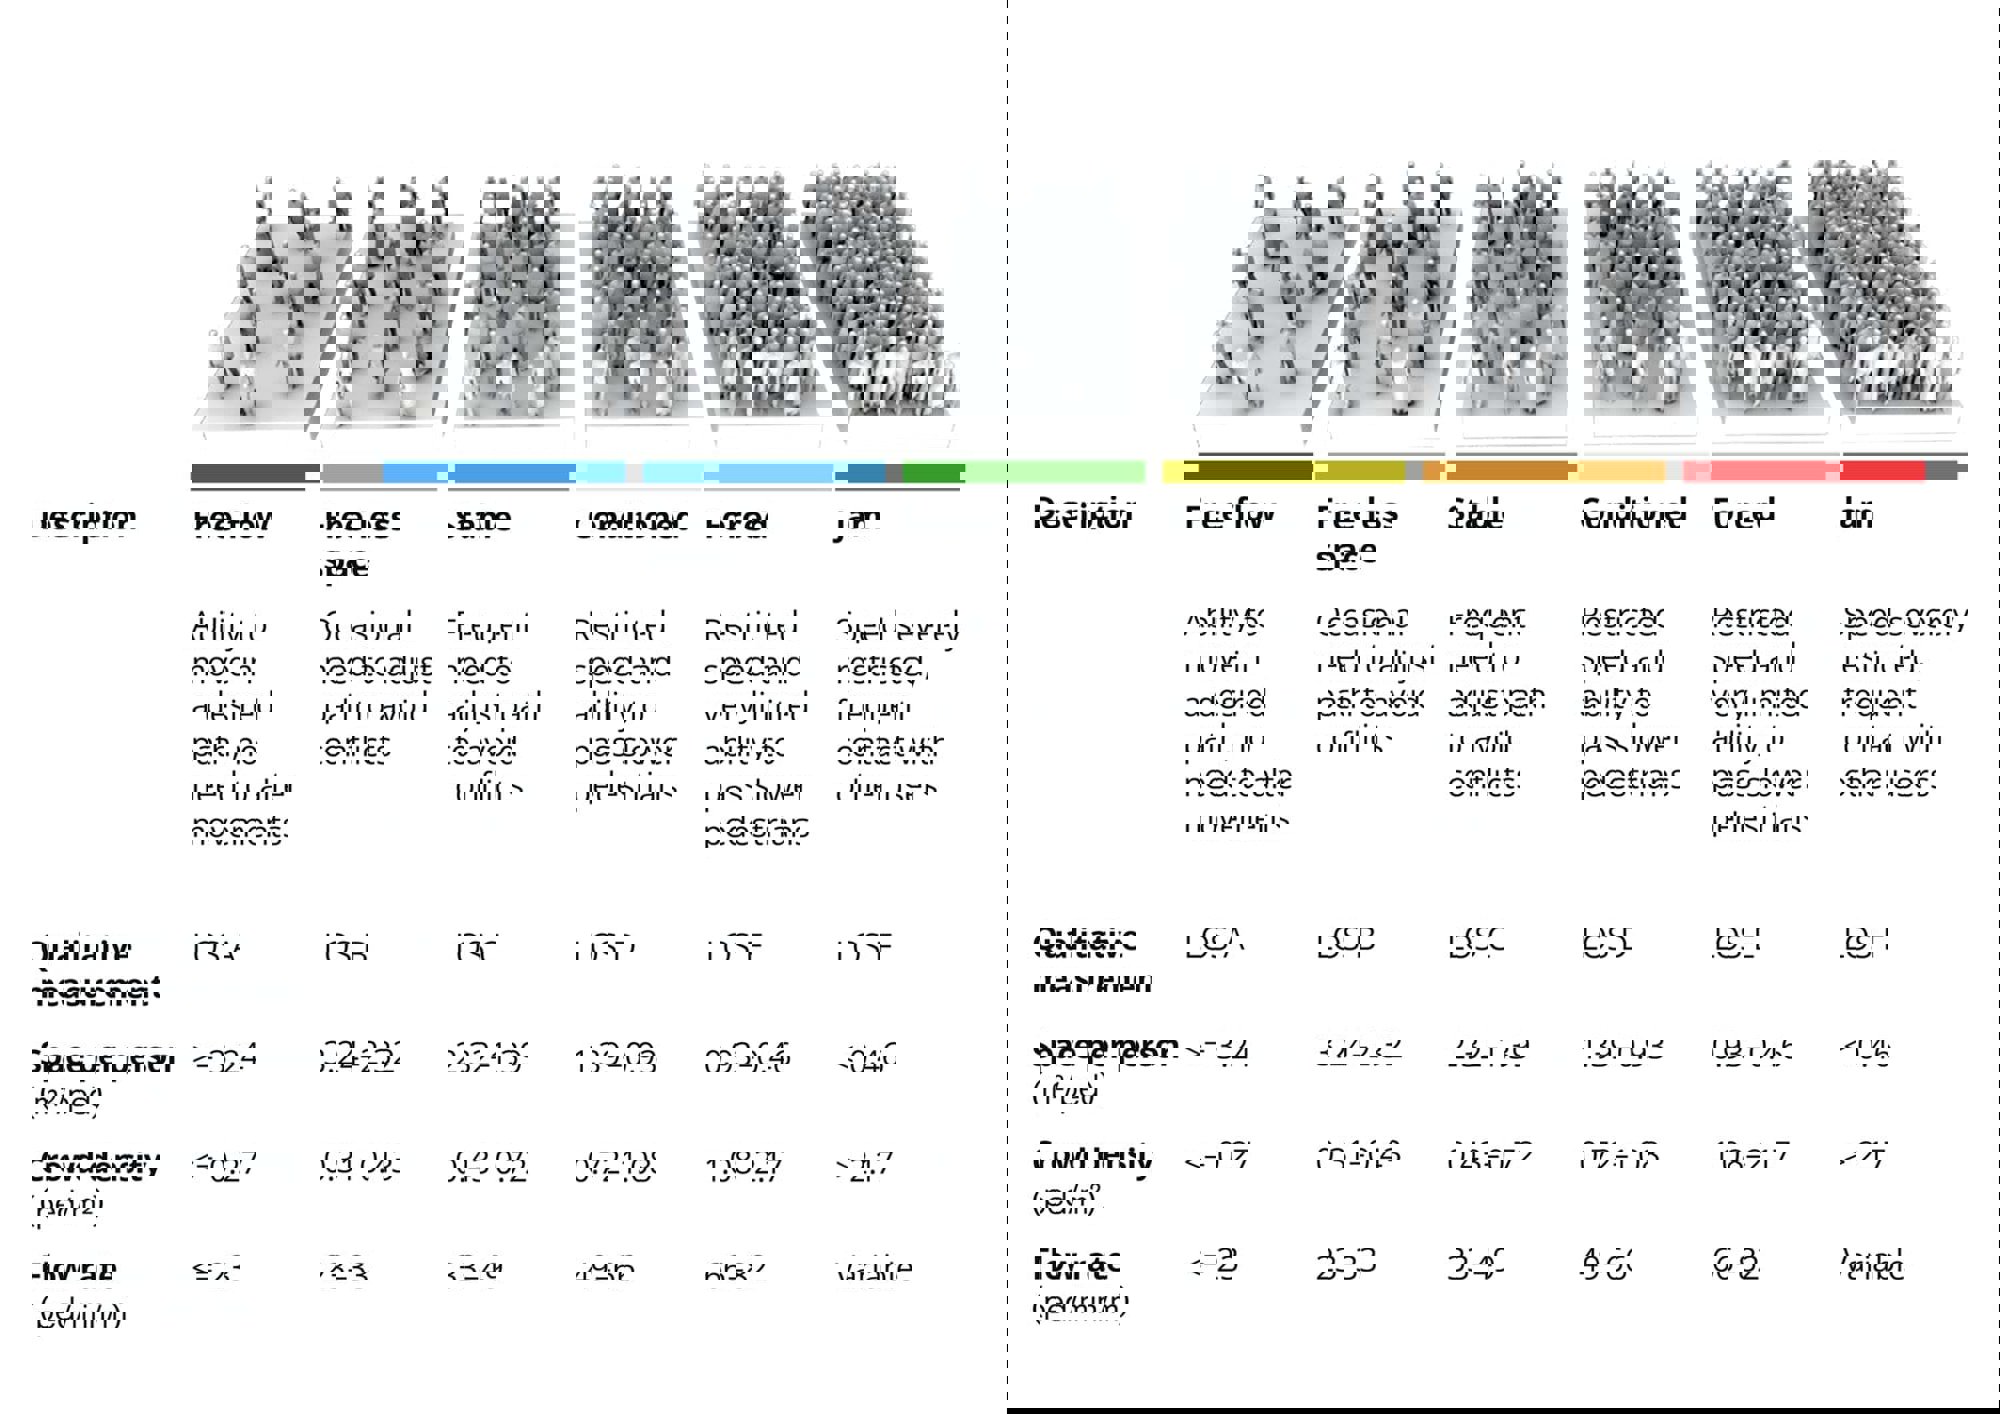
Descriptions of pedestrian densities based on John Fruin’s Levels of Service concept; according to Fruin, six levels of services should be considered for pedestrian structures (walkways, stairwells, etcetera) based on the occupation of an available space and flow. The Fruin model was determined based on walking speed, pedestrian spacing and the likelihood of conflict at various flow concentrations. © Foster + Partners
Today, human behaviour simulation tools, like MassMotion, integrate LoS and other metrics to operate in a three-dimensionally modelled environment. The tool simulates how pedestrians, presented as digital avatars, use a given space within a certain time frame – how they enter or exit, for example – and how they move within a dynamically changing crowd.
When we test a design proposal or existing scenario with MassMotion, the avatars are programmed to behave with ‘social forces’ (the multiple interactions between individuals and their surroundings), helping us reveal where crossflows and counter-flows could happen and the resulting LoS a space can have.
Being able to translate this learning into a scientific understanding of movement is key. While it is impossible to replicate human activity in a completely precise way, Foster + Partners and the UDG are providing innovation through the addition of supplementary data – often produced in-house – to replicate human behaviour in the most accurate way possible.
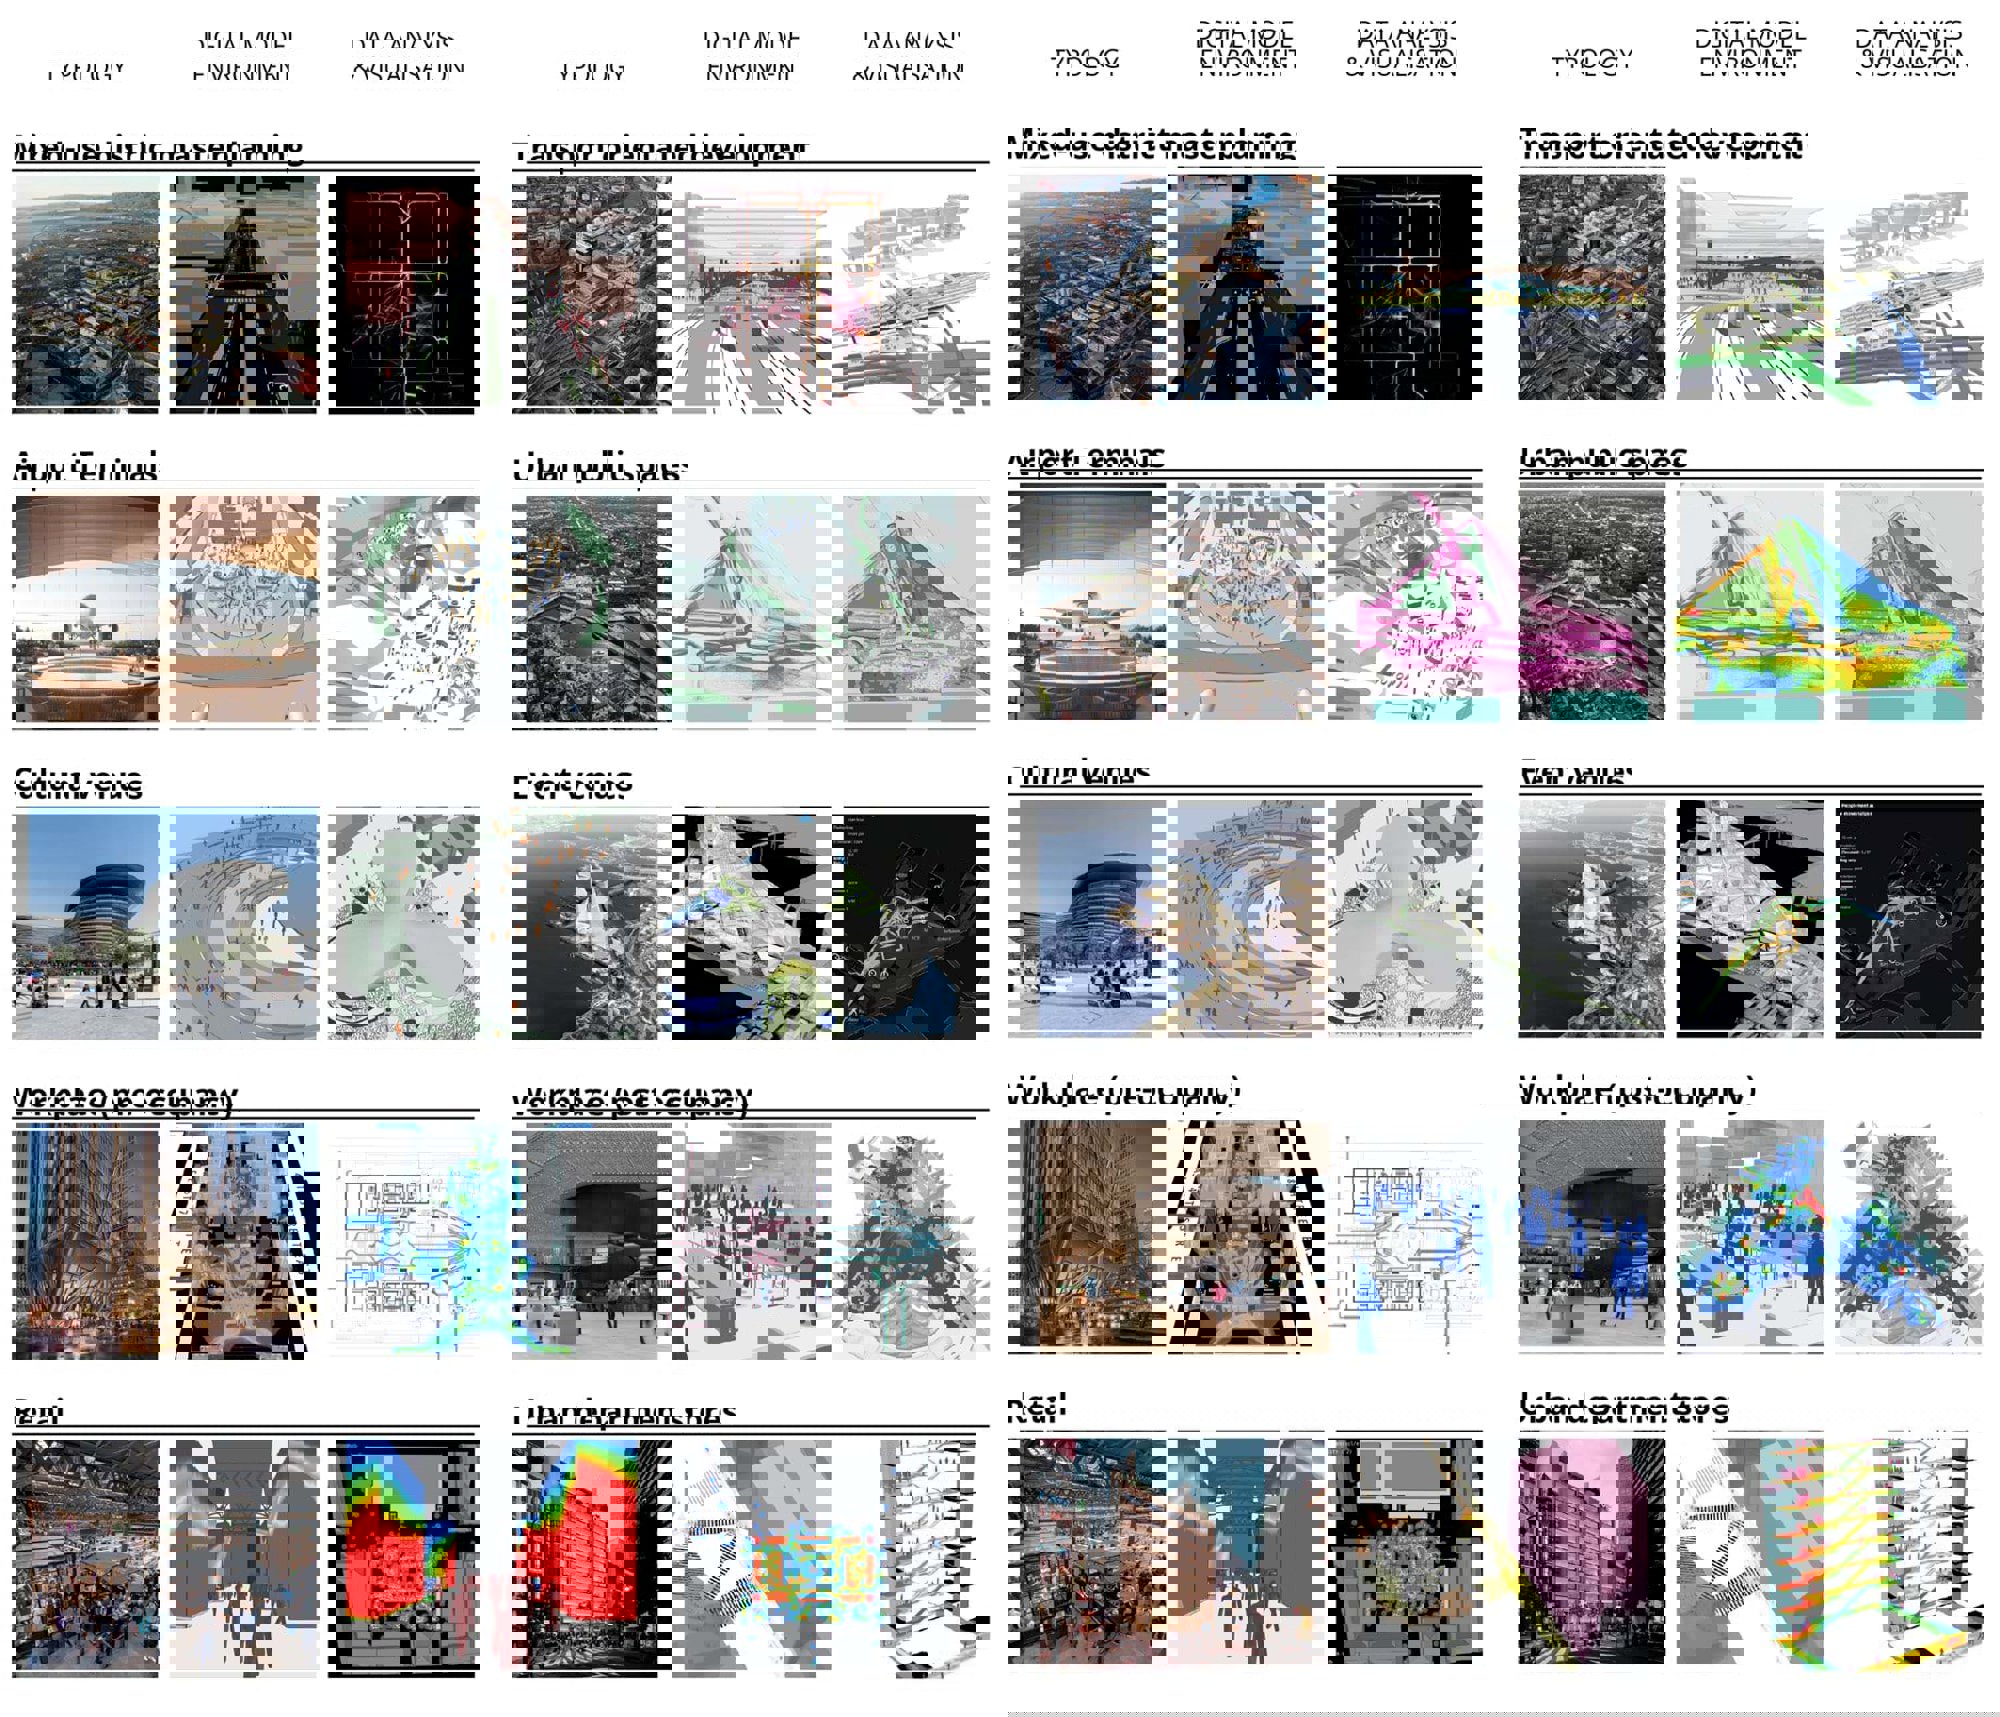
The types of environments we have applied our data-based pedestrian modelling to range from the scale of architectural design, like workplaces, retail and cultural venues, to infrastructural environments, such as airports and train stations. We have even used this modelling up to the scale of residential neighbourhoods and district masterplanning.
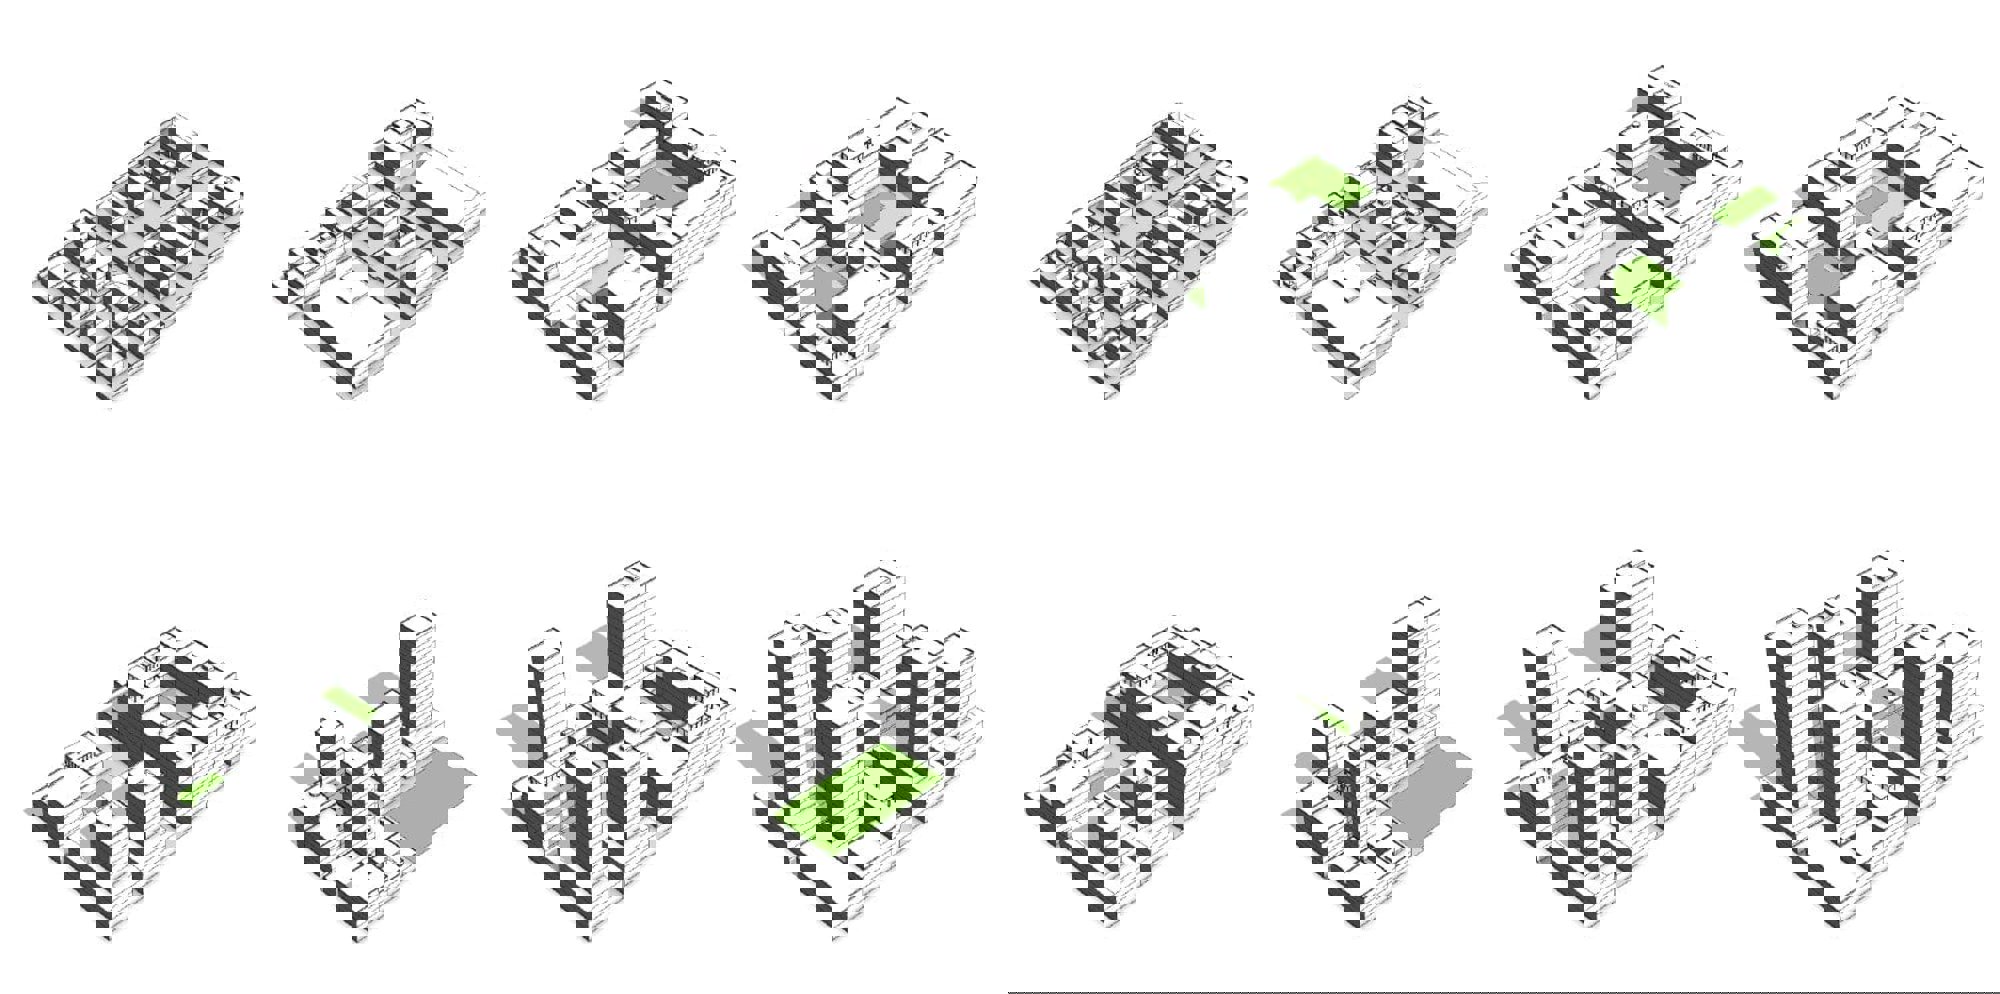
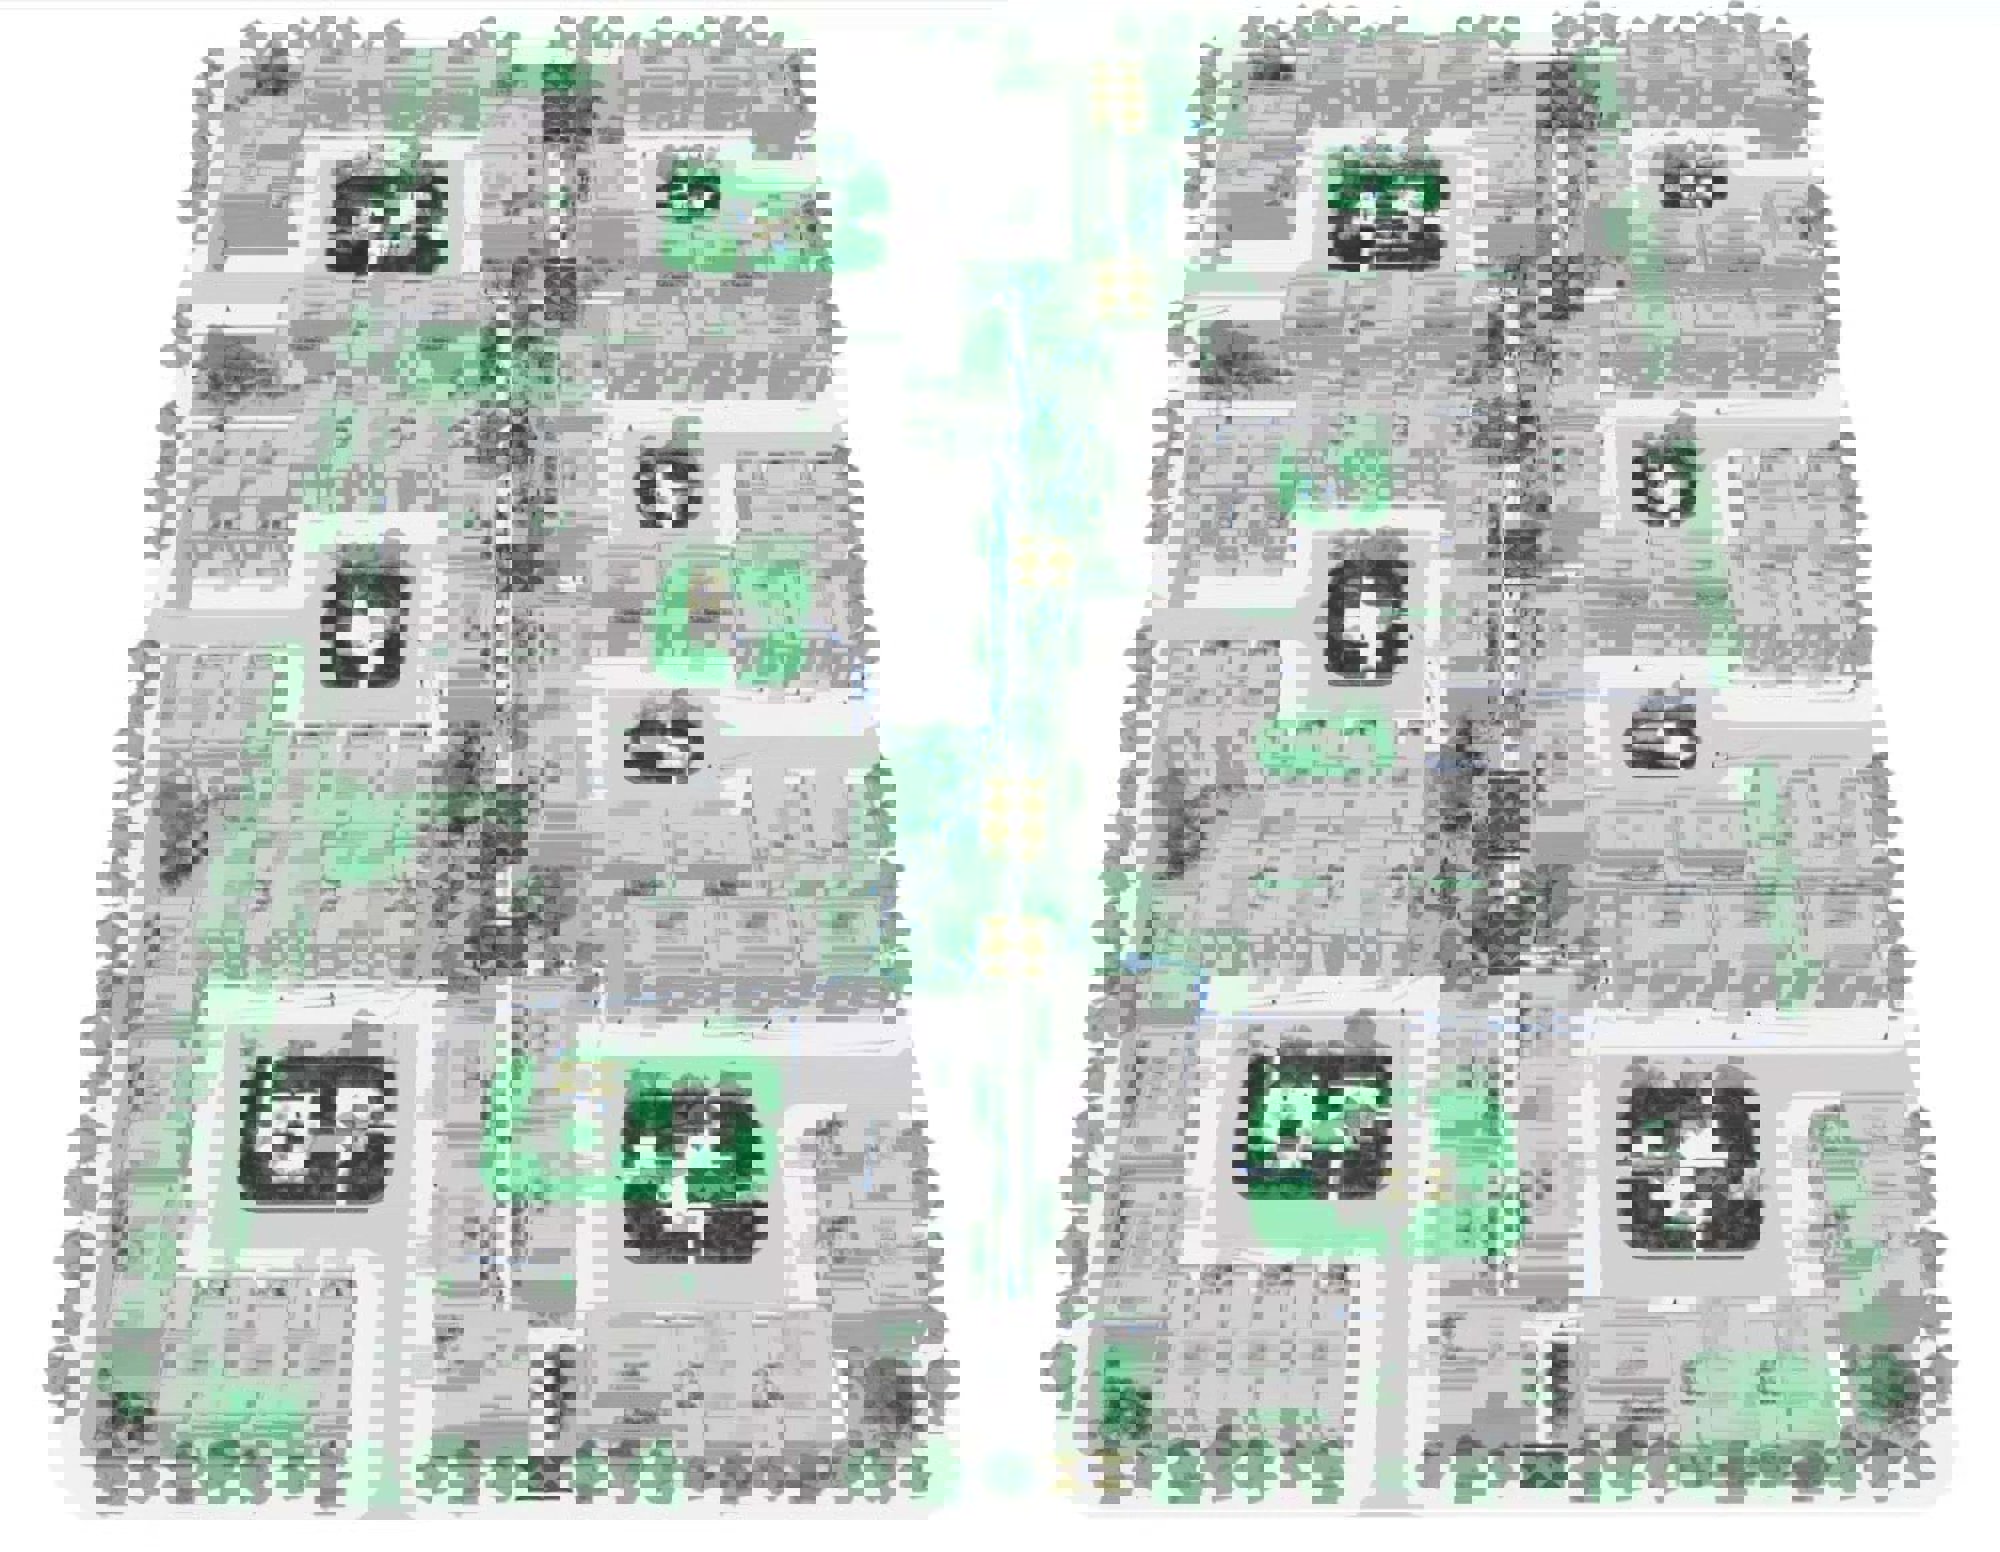
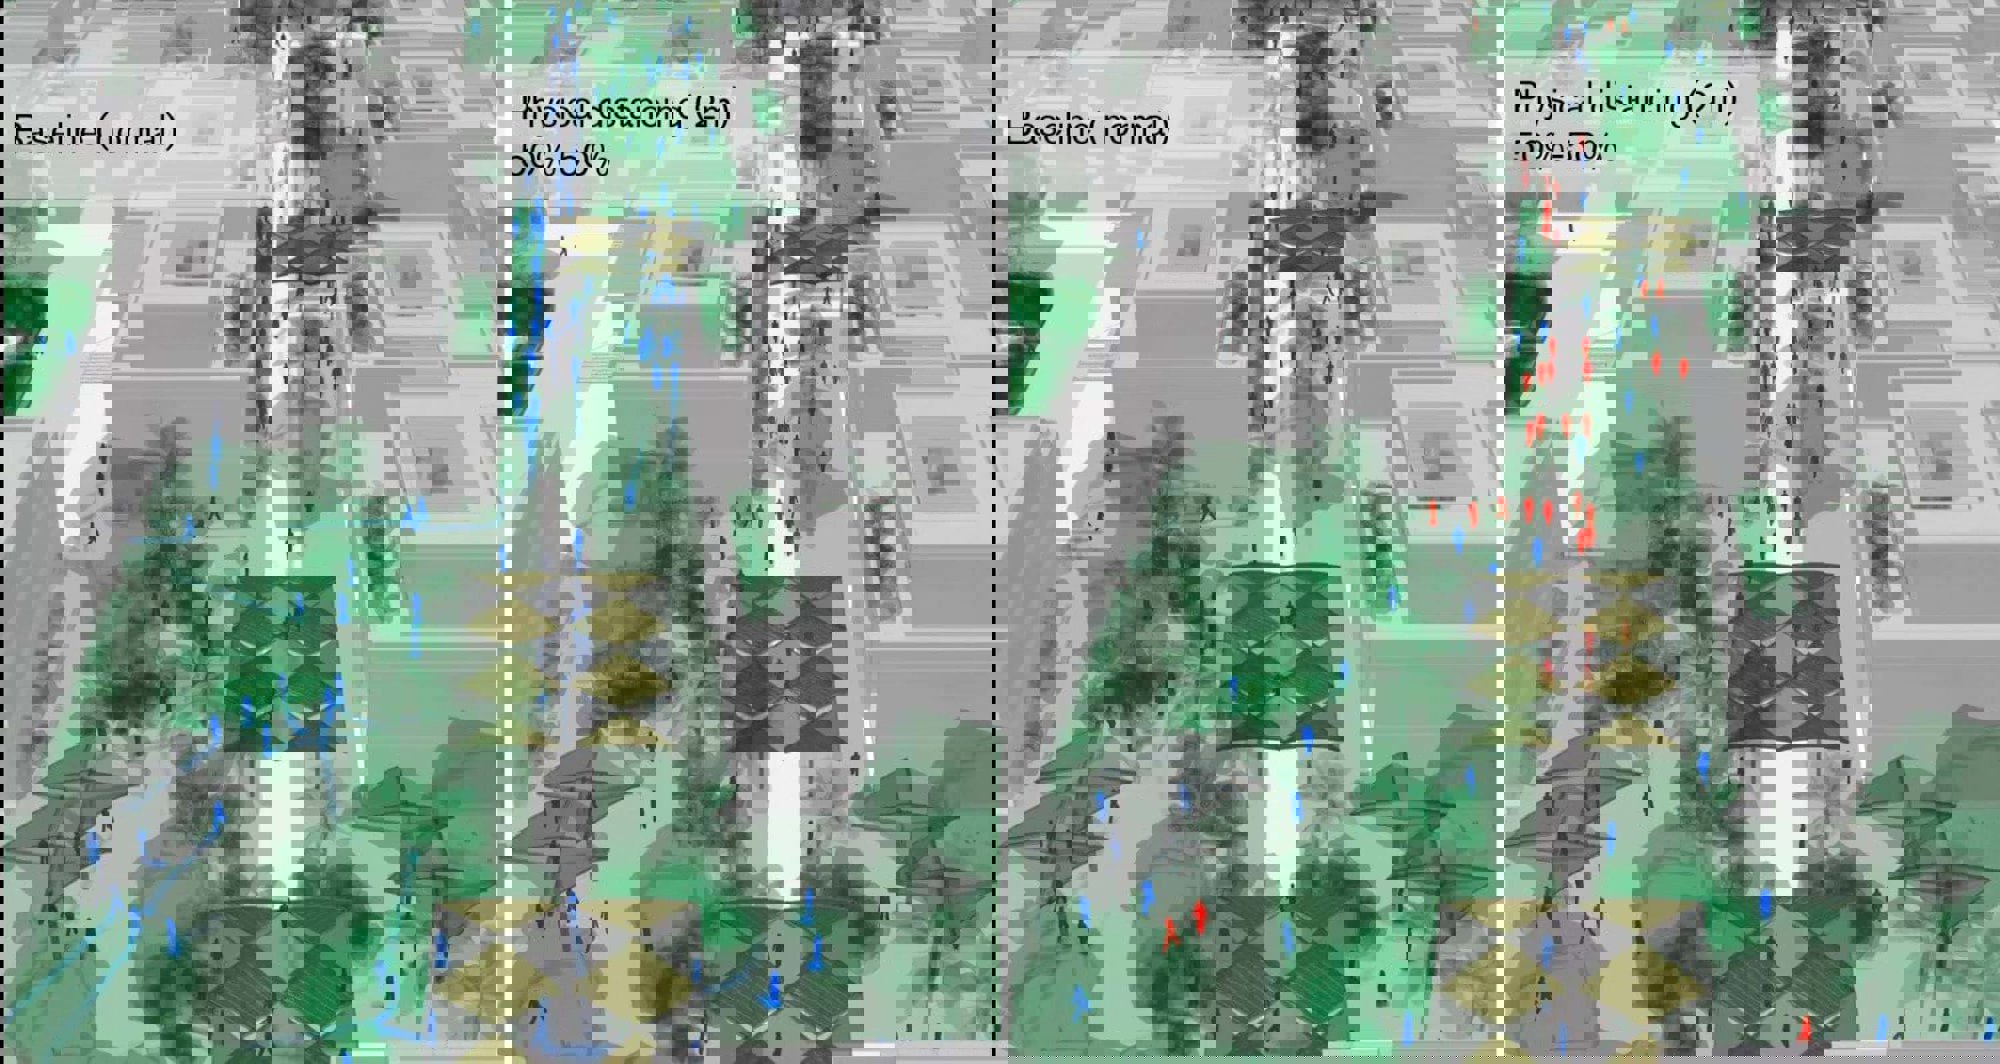
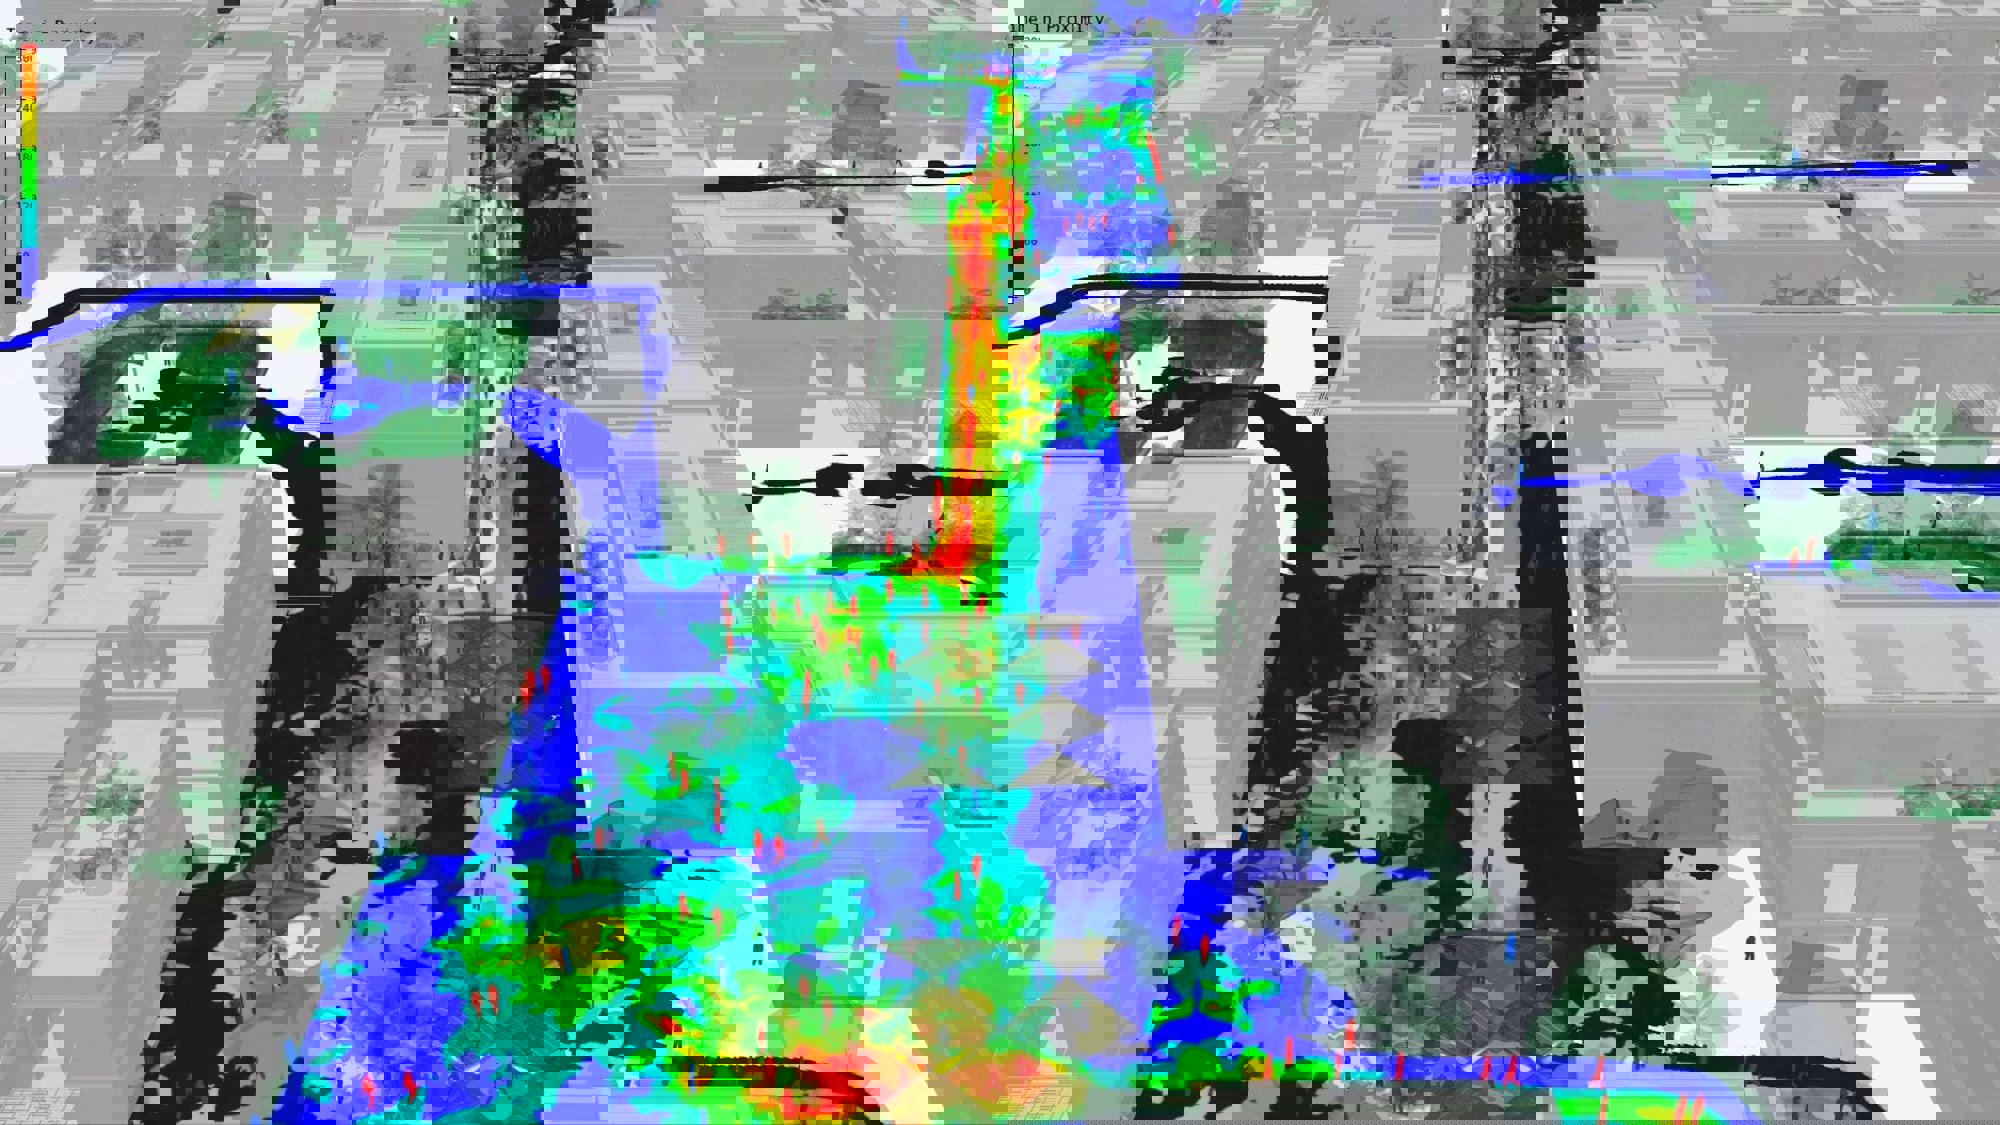
One of the team’s recent projects in this area is the use of proximity analysis in pedestrian simulations – essentially modelling social distancing – to help manage and phase the safe reopening of facilities after Covid-19 lockdowns. We are re-visiting designs to assess the lessons learnt from the pandemic. Our work for the South Sabah Al-Ahmed Masterplan in Kuwait is an example of this.
Accelerated by the unique conditions imparted on communities during to the pandemic, the trend for neighbourhoods and built-up areas increasing their open space has seen a resurgence of interest across the globe. The 61.5 square-kilometre city of South Sabah is formed of ten neighbourhood clusters and, for the client and Foster + Partners team, it was important to revisit the planning of these neighbourhoods with regards to new occupancy levels and pedestrian routes between residential clusters.
Accelerated by the pandemic, the trend for neighbourhoods and built-up areas increasing their open space has seen a resurgence of interest across the globe.
To explore the impact of social distancing and help test various mitigation scenarios, the UDG ran a proximity analysis report, which reveals how people would move within a set distance – in this case within a two-metre distance of each other. This analysis helped us test residential density against the amount of public open space within a typical neighbourhood in South Sabah. The baseline condition had shaded canopies only in main public areas, such as playgrounds and small pocket parks and we found that the areas that reached a maximum capacity while maintaining social distancing were these areas. However, providing shaded sidewalks with walkable spaces of at least three metres in width, reduced the amount of time users spent in close proximity by 50 per cent compared to the baseline.
By testing multiple scenarios, and working with additional data of neighbourhood population provided by the client, the team was able to best replicate occupant behaviour to quantify mitigation strategies; we helped both designers and client to simulate the pros and cons of an adaptable and flexible public realm.
Future trends in urban design practice with data science
For many years, we have been challenged to think about what the future of cities could be. As designers, we have the tendency to reflect on history and the lessons we can take from it; from Ebenezer Howard’s Garden City concept, or Le Corbusier’s concept of a contemporary city in his 1925 Plan Voisin in Paris, to the plan for the post-fire rebuilding of London in 1666. While often informative, many of these planning and design responses were developed in disciplinary silos, which led to decisions being taken on the basis of poor or purely subjective information.
In reality, the world we inhabit is not siloed, but inter-connected and complex; in our cities, relationships exist in multiple dimensions: social, economic, political, physical, environmental and so on. To better understand them, scientists have endeavoured to organise and sometimes simplify these relationships with new theories and laws. However, the sheer number of actors and interactions have made these historical approaches to predicting human systems extremely difficult and unreliable.
As we have seen, it is urban data science that has emerged to help us better understand the mathematics and material that underpin these systems and the growth and evolution of urban settlements. Today, we have an array of powerful data-based urban and statistical methodologies but, at Foster + Partners, we are always looking to the future.
Advances in machine learning are opening possibilities for generating new information and augmenting existing data, speeding up analysis through the development of surrogate models (as described by our Applied Research and Development group in their +Plus feature on machine learning). It is also generating new design paradigms that incorporate both machine and human intelligence. In the first case, there is a wealth of information yet to be extracted from urban imagery. For example, a lot of work is being done to enable us to accurately estimate the amount of greenery in entire cities by using machine learning methods on street view photography.
It is urban data science that has emerged to help us better understand … the growth and evolution of urban settlements. Today, we have an array of powerful data-based urban and statistical methodologies but, at Foster + Partners, we are always looking to the future.
In the future, we can imagine being able to generate our own data, such as population estimates or classification of building typologies, for places where it is not readily available. Existing analytical models that can take days or weeks to compute, such as those related to environmental analysis, can be replaced in early stages with surrogate models using machine learning approaches. This allows us to quickly understand constraints and iterate different creative options at the very earliest design stages. Additionally, such models can help reverse engineer typical design workflows, allowing designers to start with the outcomes they would like and generate the appropriate geometry.
Lastly, taking advantage of recent advances in artificial intelligence and leveraging these with feedback from designers (an approach known as ‘human in the loop’), machine learning can be used to explore design options and arrive at novel design solutions that are both technically sound and incorporate subjective criteria. As these tools and methods mature, they will form an integral part of our urban designers’ toolset.
Harnessing data-driven urban planning and design is the new present. Foster + Partners and the UDG are using advanced computational tools to incorporate big data into urban design; championing watertight urban science and allowing for theories to be challenged with alternative hypotheses and rigorously tested. Tomorrow, utilising machine learning and artificial intelligence-driven algorithms to create plans and predict their impacts will make architectural and urban planning professions adapt to new perspectives and will help to further address the climate emergency in our cities.
Author
Laura Narvaez Zertuche and Mateo Neira
Author Bio
Laura Narvaez Zertuche and Mateo Neira are part of the Urban Design Group at Foster + Partners, a diverse team of planners, spatial designers, economists, transport engineers, landscape architects and researchers working together to create thriving and resilient environments.
Editors
Tom Wright